
|
Cost and Performance
Report:
|
Preparation of this report has been funded wholly or in part by the U.S. Environmental Protection Agency under Contract Number 68-W3-0001. It has been subject to administrative review by EPA headquarters and Regional staff and by the technology vendor. Mention of trade names for commercial products does not constitute endorsement or recommendation for use.
This report presents cost and performance data for a land treatment application at the Brown Wood Preserving Superfund site, located approximately two miles west of the city of Live Oak in Suwanee County, Florida. From 1948 to 1978, several different companies operated a lumber treatment facility at the site, which pressure treated lumber products mainly with creosote, and occasionally with pentachlorophenol. Soil at the site was found to have been contaminated with polynuclear aromatic hydrocarbons (PAHs).
After completion of several interim removal activities at the site, a Record of Decision (ROD) was signed on April 8, 1988. The ROD specified the construction, operation, and maintenance of a land treatment area (LTA) as the remedial action for treatment of PAH-contaminated soils that were stockpiled during the removal activities. The ROD required that, within two years, the concentrations of Total Carcinogenic Indicator Chemicals (TCICs) in the soil must be reduced to below 100 mg/kg. The concentration of TCICs was measured as the sum of the concentrations of six PAHs, which were selected by EPA based on the results of a risk assessment.
Construction of the LTA was completed in October 1988. Stockpiled soil was placed in the LTA in three lifts, beginning in January 1989. Approximately 8,100 cubic yards of stockpiled soil were treated in the LTA. Using this land treatment application, the cleanup goal of less than 100 mg/kg TCICs in soil was achieved within 18 months, six months ahead of the two-year limit specified in the ROD. The LTA was revegetated in October 1991 and approximately 90% of the former LTA was covered with native grasses by March 1992.
This application is of note as it was one of the early applications of land treatment at a Superfund site contaminated with creosote compounds.
The total costs for treatment activities at this site were approximately $565,409, over half of which were for short-term (up to 3 years) operation.
Table of Contents | Forward to Site Information
Brown Wood Preserving Superfund Site
Live Oak, Florida
CERCLIS #: FLD980728935
ROD Date: 8 April 1988
Type of Action: Remedial
Treatability Study Associated with Application? Information not available
at this time.
EPA SITE Program Test Associated with Application? No
Operating Period: 1/89 - 7/90
Quantity of Soil Treated During Application: 8,100 cubic yards of soil
Historical Activity That Generated Contamination at the Site: Wood
preserving
Corresponding SIC Code: 2491B (Wood Preserving Using Cresote)
Waste Management Practices That Contributed to Contamination: Manufacturing
process
Site History: The Brown Wood Preserving Superfund Site (Brown Wood) is located about two miles west of the city of Live Oak in Suwanee County, Florida, as shown in Figure 1.

Figure 1. Site Location
From 1948 to 1978, a lumber treatment facility was operated
at the site by several companies. The layout of the facility is shown in Figure
2. [3]
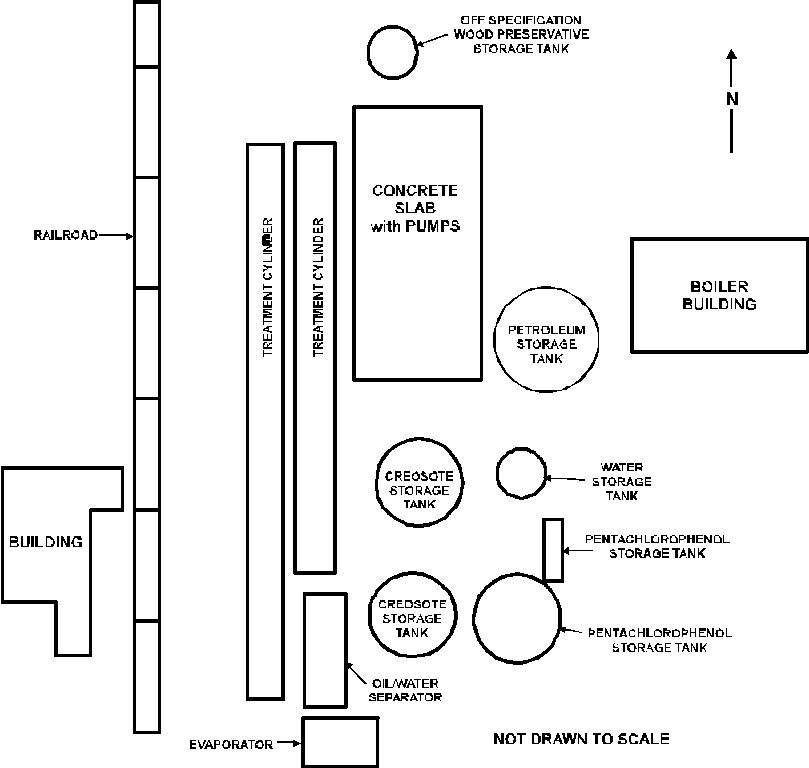
Figure 2. Site Layout [3]
The lumber treatment processes at the site included the pressure treatment of lumber products, mainly with creosote and occasionally with pentachlorophenol. Small rail cars were used to move lumber to the two treatment cylinders. A mixture of creosote and water or pentachlorophenol and petroleum was used to treat the lumber.
Wastewater from the treatment cylinders was discharged to an oil/water separator. The creosote from the oil/water separator was either sent to a storage tank for reuse, or, if determined to be off-specification, sent to the spent creosote storage tank. The wastewater from the oil/water separator was treated and discharged to a lagoon located in the southwest corner of the site via a culvert and drainage ditch. The treated lumber was dried on rail tracks and stored in an area north of the treatment cylinders. [1]
In 1981, a former owner of the facility notified EPA that hazardous materials may have been handled at the site. As a result, the Florida Department of Environmental Regulations (FDER) conducted sampling at the site in July 1982, which showed that soil and sludge contaminated with a number of organic compounds were present in the area of the treatment cylinders and the lagoon. Additionally, the storage tanks and treatment cylinders contained small amounts of solidified creosote and pentachlorophenol. Based on these results, EPA placed the site on the National Priorities List in December 1982. [1]
In response to an administrative order issued by EPA in September 1983, interim removal activities were identified and specified in a January 1988 Consent Order. [1] The interim removal activities, conducted from December 1987 to March 1988, included:
Regulatory Context: The 1988 ROD established a cleanup goal of 100 mg/kg of Total Carcinogenic Indicator Chemicals (TCICs) for the stockpiled soil based on land treatment. The concentration of TCICs was measured as the sum of the concentrations of six PAHs, which were selected by EPA based on the results of a risk assessment. [1]
Remedy Selection: The following remedial action alternatives were considered for the Brown Wood Preserving Superfund site [1]:
Land treatment of soils was selected by EPA as a remedial action for Brown Wood based on cost and technical feasibility. Additionally, this remedy provided an opportunity to utilize and assess an innovative technology/bioremediation in a controlled situation. [1, 5]
Site Management: PRP Lead
Oversight: EPA
Remedial Project Manager
Martha Berry
U.S. EPA Region 4
345 Courtland St., N.E.
Atlanta, Georgia 30365
(404) 347-3016
Treatment System Vendor:
John Ryan
Remediation Technologies, Inc. (ReTeC)
1011 Southwest
Klickitat Way
Suite 207
Seattle, WA 98134
(206) 624-9349
Back to Executive Summary |
Table of Contents | Forward to Matrix Description
Type of Matrix Processed Through the Treatment System: Soil (ex situ)
Primary Contaminant Group: Polynuclear Aromatic Hydrocarbons (PAHs)
Creosote was the main contaminant at the site. Creosote consists of approximately 200 individual compounds, many of which are polynuclear aromatic hydrocarbons (PAHs). Six of these PAHs [benzo(a)anthracene, benzo(a)pyrene, benzo(b)fluoranthene, chrysene, dibenzo(a,h)anthracene, and indeno(1,2,3-cd)pyrene] were selected by EPA as indicator parameters based on the results of a risk assessment. The total concentrations of these parameters in the stockpiled soil ranged from 100 to 208 mg/kg. [1, 8]
The major characteristics affecting cost or performance of this technology and the values measured for each are presented in Table 1. These values represent the average values measured during a March 1, 1989 sampling event.
Table 1. Matrix Characteristics [11, 12]
| Parameter | Value | Measurement Method |
|---|---|---|
| Soil Classification | See discussion below | - |
| Clay content and/or particle size distribution | See discussion below | - |
| Field capacity | Not Available | - |
| pH | 6.9 | USEPA Method SW-846/9045 |
| Total Organic Carbon | 11,790 mg/kg | USEPA Method SW-846/9060 |
The matrix treated at Brown Wood was a mixture of lagoon
contents. The lagoon had a clay bottom and sandy contents, which ranged from
silty clay to fine sand, but did not lend itself to a classification analysis.
[21]
Back to Site Information | Table of Contents | Forward to Treatment System Description
Land Treatment
None
Construction of the land treatment area (LTA) involved site preparation, construction of the components of the LTA, construction of a retention pond, and installation of irrigation and drainage systems. The locations of the land treatment area, stockpile area, retention pond, and lagoon are shown in Figure 3. [12]

Figure 3. Land Treatment Area Location [12]
Site preparation activities included clearing vegetation and structures from approximately four acres. An estimated 200 yds3 of contaminated soil were excavated during the site preparation activities and stored in the central stockpile area. [2]
The construction of the LTA included [2]:
System Operation: Land treatment was performed in three lifts. For sampling purposes, the LTA was divided into eight half-acre subplots, as shown in Figure 4. [10]

Figure 4. Subplot Locations [10]
A composite sample was collected from each subplot, during each quarterly sampling event, until the concentrations of TCICs contained in the soil within the subplot was less than 100 mg/kg. [1, 8] An additional lift of soil from the stockpile area was then placed in the subplot and treated until the concentrations of TCICs in the soil were less than 100 mg/kg. This process was continued until all of the stockpiled soil had been treated. The three lifts are described below:
One problem encountered during system operation was tilling the soil after heavy rains. Soil drying normally took an average of 2 weeks before tractor access was possible. [21]
Level D personal protective equipment was required for all site personnel coming into direct contact with the contaminated soil. The equipment included coveralls, safety boots, nitrile gloves, and particulate masks. [9]
Listed in Table 2 are the operating parameters affecting treatment cost or performance for this application and the values measured for each. The following operating parameters are presented separately for each lift:
Hydrocarbon degradation was calculated based on the difference in initial and final TCIC concentrations in the first lift and dividing this value by the amount of time required for treatment of soil in that cell in the first lift.
Table 2. Operating Parameters [10-17, 19, 20]
Value |
|||||||||||
Subplot |
|||||||||||
| Parameter | A | B | C | D | E | F | G | H | Measurement Method | ||
|---|---|---|---|---|---|---|---|---|---|---|---|
| First Lift of Soil (a) | |||||||||||
| Total Heterotrophs (cfu/gm) | 6.4 × 10 - 7.4 × 10 | 1.1 × 10 - 1.6 × 10 | 7 ×10 - 9.9 × 10 | 4.1 × 10 - 2.7 × 10 | 1.5 × 10 - 7.8 × 10 | 1.0 × 10 - 4.3 × 10 | 1.9 × 10 - 4.3 × 10 | 1.8 × 10 - 4.6 × 10 | (b) | ||
| PAH Degraders (cfu/gm) | 1.0 ×10 - 5.0 × 10 | 3.0 × 10 - 2.2 × 10 | 1.0 × 10 - 5.7 × 10 | 2.0 × 10 - 7.2 × 10 | 2.8 × 10 - 1.9 × 10 | 1.4 × 10 - 5.7 × 10 | 3.6 ×10 - 1.5 × 10 | 3.2 ×10 - 3.0 × 10 | (c) | ||
| Mixing Rate/Frequency | Tilled once every 2 wks | Tilled once every 2 wks | Tilled once every 2 wks | Tilled once every 2 wks | Tilled once every 2 wks | Tilled once every 2 wks | Tilled once every 2 wks | Tilled once every 2 wks | |||
| Moisture Content (%) | 7.7 to 8.8 | 8.1 to 9.6 | 10.3 to 10.5 | 9.3 to 9.5 | 12.4 to 22.8 | 11.0 to 11.9 | 11.2 to 12.5 | 12.4 to 13.2 | Not available | ||
| pH | 6.8 | 6.8 to 7.2 | 7.0 to 7.7 | 6.6 to 7.2 | 6.7 to 6.8 | 6.8 to 7.1 | 6.4 to 6.8 | 6.5 to 6.7 | USEPA Method SW-846/9045 | ||
| Residence Time (months) | 9 | 9 | 15 | 9 | 9 | 9 | 9 | 9 | |||
| Temperature (°F) | 17 to 99 | 17 to 99 | 13 to 99 | 17 to 99 | 17 to 99 | 17 to 99 | 17 to 99 | 17 to 99 | Thermometer (d) | ||
| Carbon/Total Kjeldahl Nitrogen | 10.3 | 15.4 | 9 to 11.0 | 10.1 | 8.8 | 11.5 | 13.2 | 14.2 | Not available | ||
| Hydrocarbon Degradation (mg/kg/mo) | 58 | 18 | 13 | 38 | 28 | 20 | 38 | 38 | Calculated value | ||
| Second Lift of Soil (a) | |||||||||||
| Total Heterotrophs (cfu/gm) | 6.3 × 10 - 6.6 × 10 | 1.7 × 10 - 1.3 × 10 | N/A | 1.8 × 10 | 1.3 × 10 - 8.4 × 10 | 1.2 × 10 - 2.5 × 10 | 3.8 × 10 | 2.3 × 10 | (b) | ||
| PAH Degraders (cfu/gm) | 7.0 × 10 - 4.5 × 10 | 2.0 × 10 - 6.0 × 10 | N/A | 9.0 × 10 | 2.5 × 10 - 6.2 × 10 | 3.1 × 10 - 1.7 × 10 | 4.2 × 10 | 5.5 × 10 | (c) | ||
| Mixing Rate/Frequency | Tilled once every 2 wks | Tilled once every 2 wks | N/A | Tilled once every 2 wks | Tilled once every 2 wks | Tilled once every 2 wks | Tilled once every 2 wks | Tilled once every 2 wks | |||
| Moisture Content (%) | 10.3 to 15.4 | 12.0 to 11.6 | N/A | 12.4 | 12.9 to 21.1 | 14.5 to 19.0 | 14.8 | 12.9 | Not available | ||
| pH | 6.7 to 7.3 | 6.8 to 7.5 | N/A | 7.6 | 7.6 | 6.8 to 7.6 | 7.6 | 7.8 | USEPA Method SW-845/9045 | ||
| Residence Time (months) | 10 | 10 | N/A | 6 | 6 | 6 | 6 | 6 | |||
| Temperature (°F) | 13 to 102 | 13 to 102 | N/A | 13 to 94 | 13 to 94 | 13 to 94 | 13 to 94 | 13 to 94 | Thermometer (d) | ||
| Carbon/Total Kjeldahl Nitrogen | 25 to 36 | 15 to 20 | N/A | 78 | 8.8 to 15.0 | 11.0 to 32.0 | 46 | 18 | Not available | ||
| Third Lift of Soil (a) | |||||||||||
| Total Heterotrophs (cfu/gm) | N/A | N/A | 4.87 × 10 - 7.90 × 10 | 3.20 × 10 - 9.07 × 10 | 2.7 × 10 - 7.55 × 10 | 7.0 × 10 - 1.1 × 10 | 5.0 × 10 - 1.39 × 10 | 7.0 × 10 - 3.67 × 10 | (b) | ||
| PAH Degraders (cfu/gm) | N/A | N/A | 1.85 × 10 - 4.0 × 10 | 1.15 × 10 - 3.0 × 10 | 5.5 × 10 - 4.0 × 10 | 2.75 × 10 - 3.0 × 10 | 7.5 × 10 - 4.90 × 10 | 2.95 × 10 - 8.0 × 10 | (c) | ||
| Mixing Rate/Frequency | N/A | N/A | Tilled once every 2 wks | Tilled once every 2 wks | Tilled once every 2 wks | Tilled once every 2 wks | Tilled once every 2 wks | Tilled once every 2 wks | |||
| Moisture Content (%) | N/A | N/A | 12.6 to 16.3 | 13.9 to 14.6 | 8.5 to 14.7 | 9.4 t 13.9 | 8.9 to 14.0 | 8.9 to 14.2 | Not available | ||
| pH | N/A | N/A | 6.4 to 7.0 | 6.5 to 6.8 | 6.6 to 6.9 | 6.7 to 6.9 | 6.7 to 7.0 | 6.7 to 7.0 | USEPA Method SW-846/9045 | ||
| Residence Time (months) | N/A | N/A | 4 | 4 | 4 | 4 | 4 | 4 | |||
| Temperature (°F) | N/A | N/A | 29 to 102 | 29 to 102 | 29 to 102 | 29 to 102 | 29 to 102 | 29 to 102 | Thermometer (d) | ||
| Carbon/Total Kjeldahl Nitrogen | N/A | N/A | 30 to 37 | 15 to 58 | 20 to 31 | 43 to 67 | 6 to 51 | 30 to 32 | Not available | ||
N/A - This lift of soil was not applied to this subplot.
(a) - The values for each lift of soil are ranges of values measured in samples
collected from the time that the lift was applied to the subplot until the next
lift of soil was applied to the subplot
(b) - "Agar-Plate Method for Total Microbial
Count," F. Clark, Methods of Soil Analysis, Vol. 2,
pp. 1460-1465.
(c) - "Replica Plating Method for Estimating Phenanthrene-Utilizing and
Phenanthrene-Cometabolizing Microorganisms," Shiaris, M., Cooney, J.,
Applied and Environmental Microbiology, February 1983,
Vol. 45, No. 2, pp. 706-710.
(d) - These values are for the ambient air temperatures measured between
application of lifts.
The timeline for this application is presented in Table 3.
Table 3. Timeline [10-17, 19, 20]
| Start Date | End Date | Activity |
|---|---|---|
| December 8, 1983 | - | Brown Wood added to National Priorities List. |
| December 1987 | March 1988 | Interim removal actions conducted at the site. |
| April 18, 1988 | - | ROD signed. |
| October 1988 | January 1989 | Remedial action construction activities completed. |
| January 1989 | - | First lift of soil applied to all subplots. |
| March 1, 1989 | March 15, 1989 | Soil inoculated with PAH-degrading microorganisms at a frequency of two applications per week. |
| March 1, 1989 | - | Soil sampled and analyzed for PAHs and nutrients. |
| June 6, 1989 | - | Soil sampled and analyzed for PAHs and nutrients. |
| September 12, 1989 | - | Soil from Subplots C and D sampled and analyzed for PAHs. Cleanup goal met for all subplots except Subplot C. |
| September 15, 1989 | - | Second lift of soil applied to all subplots except Subplot C. |
| September 16, 1989 | - | Soil from all subplots except Subplot C sampled and analyzed for PAHs and nutrients. Cleanup goal met for all subplots except Subplots E and F. |
| December 15, 1989 | - | Soil from Subplots C, E, and F sampled and analyzed for PAHs and nutrients. Cleanup goal met for all subplots. |
| March 14, 1990 | - | Third lift of soil (remaining soil in the stockpile area) applied to Subplots C through H. |
| March 15, 1990 | - | Soil from Subplots C through H sampled and analyzed for PAHs and nutrients. |
| July 24, 1990 | - | Soil from all subplots sampled and analyzed for PAHs and nutrients. Cleanup goal met for all subplots. |
| January 1991 | - | Target date for completion. |
| June 1991 | - | Cultivation of the LTA completed. |
| November 1991 | - | Vegetative cover planted over LTA. |
| March 1992 | - | Ninety percent of LTA covered with grass |
Back to Matrix Description | Table of Contents | Forward to Treatment System Performance
The ROD specified cleanup goals for polynuclear aromatic hydrocarbons in terms of total carcinogenic indicator chemicals (TCICs). TCICs were defined as equal to the sum of the concentrations of the following six polynuclear aromatic hydrocarbons:
These indicator chemicals were selected by EPA based on their concentrations in sludge and soil at the site and their carcinogenic nature. [1]
The ROD required that within two years from its initial seeding, the land treatment process must reduce the concentration of TCICs to 100 mg/kg throughout the volume of the material treated (based on quarterly sampling results), and that, upon successful completion of the bioremediation in the land treatment area, the land treatment area must be revegetated. [1, 8]
The 100 mg/kg cleanup standard for TCICs was based on the results of a risk assessment for the site. This level corresponds to a 1 x 10⁻⁶ soil ingestion risk level. [1]
Composite samples were collected from each half-acre subplot, as described earlier in this report. These samples were analyzed for PAHs using EPA Method 8270. [9, 10] Table 4 shows the concentrations of TCICs measured in the seven sampling events during the bioremediation of soils at Brown Wood. Samples collected on 12/15/89 and 7/24/90 were collected after cultivating the soil lift with previously applied lifts. Analytical results for individual PAH constituents are presented in Appendix A.
Table 4. TCIC Concentrations [9, 10, 11, 12, 20]
|
|||||||||||
| Date | Event | A | B | C | D | E | F | G | H | ||
|---|---|---|---|---|---|---|---|---|---|---|---|
| January 1989 | Soil application* (Lift #1) | Yes | Yes | Yes | Yes | Yes | Yes | Yes | Yes | ||
| March 1, 1989 | Soil sampling | 258 | 103 | 201 | 255 | 161 | 126 | 186 | 167 | ||
| June 6, 1989 | Soil sampling | 73 | 46 | 147 | 478 | 73 | 63 | 65 | 45 | ||
| September 12, 1989 | Soil sampling | NA | NA | 120 | 1 5 | NA | NA | NA | NA | ||
| September 15, 1989 | Soil application (Lift #2) | Yes | Yes | No | Yes | Yes | Yes | Yes | Yes | ||
| September 16, 1989 | Soil sampling | 71 | 95 | NA | 44 | 111 | 111 | 49 | 88 | ||
| December 15, 1989 | Soil sampling | NA | NA | 72 | NA | 18 | 41 | NA | NA | ||
| March 14, 1990 | Soil application (Lift #3) | No | No | Yes | Yes | Yes | Yes | Yes | Yes | ||
| March 15, 1990 | Soil sampling | NA | NA | 25 | 36 | 59 | 57 | 51 | 54 | ||
| July 24, 1990 | Soil sampling | 59 | 75 | 77 | 92 | 57 | 34 | 23 | 27 | ||
*No samples were collected from lift #1 at the time of soil application. A TCIC concentration of 100 to 208 mg/kg was measured in the stockpiled soils prior to soil application.
NA - Not analyzed.
The land treatment application at Brown Wood met the cleanup goal for TCICs in all 8 subplots, within 18 months. The data indicate that biodegradation rates differed among the subplots. For example, Subplot A achieved the cleanup goal in LTA #1 sooner (i.e., within 3 months) than in Subplot C (i.e., within 9 months).
The land treatment application at Brown Wood was conducted in 3 lifts, and the data assessment is presented below for each lift.
Lift #1: An assessment of the data presented in Table 4 indicates that the concentrations of TCICs in the samples collected during the first sampling event (3/1/89), after the first soil lift was applied, ranged from 103 to 258 mg/kg. The concentrations of TCICs in each subplot measured in samples collected on 3/1/89 was greater than the 100 mg/kg level. The concentrations of TCICs measured during the 6/6/89 sampling event were less than the 100 mg/kg level in all subplots except Subplots C and D. The concentrations of TCICs measured during a 9/12/89 sampling event showed that the 100 mg/kg level had been achieved for Subplot D, but not for Subplot C. The concentration of TCICs measured in the sample collected on 12/15/89 from Subplot C was less than the 100 mg/kg level.
An assessment of the relative rates of biodegradation among the subplots for Lift #1 indicates that rates varied from as high as a 58 mg/kg decrease per month (e.g., for Subplot A) to as low as a 13 mg/kg decrease per month (e.g., for Subplot C).
Lift #2: On 9/15/89, a second lift of soil from the stockpile was applied to all subplots except Subplot C. This lift was sampled on 9/16/89 prior to tilling. The results from the 9/16/89 sampling event indicated that the concentrations of TCICs in all subplots except Subplots E and F were less than the 100 mg/kg level. Concentrations of several PAH constituents sampled on 9/16/89 were slightly higher (within a factor of 3) than those measured in samples from the 6/6/89 sampling event.
Sampling of Subplots E and F conducted on 12/15/89 indicated that the concentrations of TCICs were less than the 100 mg/kg level in all subplots of the LTA.
Lift #3: On 3/14/90, the third lift of stockpiled soil was applied to Subplots C through H of the LTA. This lift was sampled on 3/15/90 prior to tilling. The results from the 3/15/90 sampling indicated that the concentrations of TCICs in Subplots C through H were less than the 100 mg/kg level.
Verification samples were collected on 7/24/90 from all subplots. The results of this sampling event indicated that the concentrations of TCICs in all of the subplots in the LTA were less than the 100 mg/kg cleanup goal. The concentrations of TCICs measured in these samples ranges from 23 to 92 mg/kg.
As discussed above, although the concentrations of PAHs in the soil stockpiled for land treatment were measured during the removal activities, the initial concentrations of PAHs in the first lift applied to the LTA were not measured. Additionally, once the cleanup standard was achieved in a subplot, the subplot was not monitored further unless an additional lift of soil was applied. Therefore, the available performance data are suitable for characterizing indicator constituents in the treated soil matrix, and for correlating constituent concentrations and operating parameters.
A rigorous quality assurance/quality control (QA/QC) program for sampling and analytical activities was outlined in the Remedial Design/Remedial Action (RD/RA) Work Plan and approved by EPA. [9] Appendices to the quarterly status and semi-annual operation and maintenance reports [10 through 17] include raw QA/QC data from the laboratory reports for each sampling event, including results for matrix spike, duplicate, and blank samples.
ReTeC conducted sampling and analysis activities over the course of the soil remediation. EPA performed oversight of sampling activities and verified analytical accuracy and precision by splitting samples during three sampling events. Deviations from the field sampling procedures outlined in the RD/RA Work Plan were observed by EPA, but none were determined by EPA to be serious enough to reject the data. The split sample results were consistent for all three sampling events. [8]
Back to Treatment System Description | Table of Contents | Forward to Treatment System Cost
The remedial activities at Brown Wood were managed by the potentially responsible parties (PRPs) with EPA oversight. The PRPs contracted with ReTeC to conduct the remedial activities at the site.
Tables 5, 6, and 7 present the costs for the land treatment application at Brown Wood. In order to standardize reporting of costs across projects, costs are shown in Tables 5, 6, and 7 according to the format for an interagency Work Breakdown Structure (WBS). The WBS specifies 9 before-treatment cost elements, 5 after-treatment cost elements, and 12 cost elements that provide a detailed breakdown of costs directly associated with treatment. Tables 5, 6, and 7 present the cost elements exactly as they appear in the WBS, along with the specific activities, and unit cost and number of units of the activity (where appropriate), as provided by the treatment vendor.
As shown in Table 5, the vendor provided actual and estimated cost data that shows a total of $565,406 for cost elements directly associated with treatment of 8,100 cubic yards of soil (i.e., excluding before and after treatment cost elements). This total treatment cost corresponds to $70 per cubic yard of soil treated. In addition, the vendor provided cost data that show a total of $58,039 for before-treatment costs and $9,827 for after-treatment costs. The vendor indicated that there were no costs in this application for the following elements in the WBS: surface water collection and control; groundwater collection and control; air pollution/gas collection and control; liquids/sediments/sludges collection and containment; drums/tanks/structures/miscellaneous demolition and removal; liquid preparation and handling; vapor/gas preparation and handling; pads/foundations/spill control; startup/testing/permits; training; cost of ownership; dismantling; decontamination and decommissioning; disposal (other than commercial); disposal (commercial); or site restoration. The vendor provided no information on costs for monitoring, sampling, testing, and analysis in this application. Note that the vendor provided a total cost value for mobilization and demobilization; the values shown in Tables 6 and 7 were calculated based on the assumption that these cost elements were equal in value.
The cost data in Tables 5, 6, and 7 show estimated values for construction activities (solids preparation and handling, mobilization/setup, mobilization and preparatory work, site work, solids collection and containment, and demobilization), which are based on proposed unit prices provided by the vendor. No actual cost data are available for these activities. The costs for operations and maintenance shown in Table 5 are actual costs reported by the vendor.
Costs for similar operations were estimated by the treatment vendor to range from $50 to $100 per cubic yard of soil treated for quantities in excess of 3,000 cubic yards. [21]
Table 5. Treatment Cost Elements [21]
| Cost Element | Cost | Actual (A) or Estimated (E) Value |
|---|---|---|
| Solids Preparation and Handling | ||
| - spreading of contaminated soil $2.77/yd x 3,200 yd |
$8,864 | E |
| Mobilization/Setup | ||
| - installation of clay liner $3.23/yd x 7,000 yd |
$22,610 | E |
| - installation of subsurface drainage network lump sum | $68,062 | E |
| - construction of perimeter containment berms $3.29/ft x 2,000 ft |
$6,580 | E |
| - shape retention pond lump sum | $3,293 | E |
| - installation of runon drainage swales $1.15/ft x 3,000 ft |
$3,450 | E |
| - installation of irrigation system lump sum | $20,312 | E |
| Operation (short-term - up to 3 years) | ||
| - 1988 O&M (construction management) | $36,883 | A |
| - 1989 O&M (includes approximately $40,000 for groundwater monitoring) | $194,118 | A |
| - 1990 O&M (includes approximately $40,000 for groundwater monitoring) | $80,560 | A |
| Operation (long-term - over 3 years) | ||
| - 1991 O&M (groundwater monitoring and site restoration) | $60,477 | A |
| - 1992 O&M (groundwater monitoring and site restoration) | $37,307 | A |
| - 1993 O&M (groundwater monitoring and site restoration) | $22,891 | A |
| TOTAL | $565,406 | E |
Table 6. Before Treatment Cost Elements [21]
| Cost Element | Cost | Actual (A) or Estimated(E) Value |
|---|---|---|
| Mobilization and Preparatory Work | ||
| - mobilization of equipment, material, and personnel lump sum | $9,827 | E |
| Site Work | ||
| - site preparation $4,781.17/acre x 5 acres |
$23,906 | E |
| - fence lump sum |
$22,610 | E |
| Solids Collection and Containment | ||
| - stockpile remaining soil $0.53/yd3 x 3,200 yd3 |
$1,696 | E |
Table 7. After Treatment Cost Elements [21]
| Cost Element | Cost | Actual (A) or Estimated(E) Value |
| Demobilization - demobilization of equipment, material, |
$9,827 | E |
Back to Treatment System Performance | Table of Contents | Forward to Observations and Lessons Learned
Back to Treatment System Cost | Table of Contents | Forward to References
This case study was prepared for the U.S. Environmental Protection Agency's Office of Solid Waste and Emergency Response, Technology Innovation Office. Assistance was provided by Radian Corporation under EPA Contract No. 68-W3-0001.
Back to Observations and Lessons Learned | Table of Contents | Forward to Appendix A - Individual PAH Analytical Results
| Concentration in mg/kg | |||||||||
| Subplot | |||||||||
| Constituent | Sample Date(a) | A | B | C | D | E | F | G | H |
|---|---|---|---|---|---|---|---|---|---|
| Chrysene | 3/1/89 | 79 | 33 | 53 | 70 | 48 | 39 | 57 | 50 |
| 6/6/89 | 21 | 12 | 43 | 150 | 22 | 17 | 19 | 13 | |
| 9/12/89 | NA | NA | 36.9 | 2.6 | NA | NA | NA | NA | |
| 9/16/89 | 22 | 30 | NA | 14 | 37 | 38 | 15 | 26 | |
| 12/15/89 | NA | NA | 31.5 | NA | 18 | 23.5 | NA | NA | |
| 3/15/90 | NA | NA | 8.9 | 12 | 22 | 21 | 17 | 20 | |
| 7/24/90 | 19 | 26 | 27 | 35 | 18 | 9.5 | 4.5 | 6.9 | |
| Benzo(a)anthracene | 3/1/89 | 110 | 36 | 70 | 93 | 60 | 50 | 81 | 71 |
| 6/6/89 | 17.0 | 10 | 46 | 180 | 23 | 17 | 16 | 12 | |
| 9/12/89 | NA | NA | 31.9 | 2.2 | NA | NA | NA | NA | |
| 9/16/89 | 24 | 30 | NA | 13 | 38 | 35 | 14 | 25 | |
| 12/15/89 | NA | NA | 22.5 | NA | ND (12.5) | 17 | NA | NA | |
| 3/15/90 | NA | NA | 5.8 | 7.5 | 16 | 13 | 11 | 12 | |
| 7/24/90 | 11 | 18 | 18 | 23 | 12 | 5.9 | 5.2 | 4.1 | |
| Benzo(b)fluoranthene | 3/1/89 | 41 | 16 | 48 | 55 | 27 | 18 | 27 | 24 |
| 6/6/89 | 20 | 13 | 36 | 98 | 17 | 15 | 16 | 12 | |
| 9/12/89 | NA | NA | 31 | 5.1 | NA | NA | NA | NA | |
| 9/16/89 | 14 | 22 | NA | 11 | 23 | 23 | 13 | 22 | |
| 12/15/89 | NA | NA | 18 | NA | ND (12.5) | ND (12.5) | NA | NA | |
| 3/15/90 | NA | NA | 6.7 | 8.2 | 10 | 12 | 12 | 11 | |
| 7/24/90 | 14 | 15 | 16 | 17 | 12 | 8.1 | 6.6 | 6.8 | |
| Benzo(a)pyrene | 3/1/89 | 17 | 11 | 20 | 17 | 12 | 14 | 14 | 14 |
| 6/6/89 | 8.2 | 6.5 | 14 | 7.5 | 10 | 10 | 6.2 | 6.2 | |
| 9/12/89 | NA | NA | 11.6 | NA | NA | NA | NA | NA | |
| 9/16/89 | 8.4 | 13 | NA | 13 | 15 | 7.4 | 11 | 11 | |
| 12/15/89 | NA | NA | ND (17.0) | ND (17.5) | ND (17.5) | NA | NA | NA | |
| 3/15/90 | NA | NA | 3.5 | 7.1 | 6.9 | 6.5 | 6.5 | 7.3 | |
| 7/24/90 | 7.7 | 8.9 | 10 | 7 | 5 | 3 | 3 | 5 | |
| Dibenzo(a,h)anthracene | 3/1/89 | 2.9 | 1.8 | 2.4 | 3.2 | 2.5 | 1.8 | 1.9 | 2 |
| 6/6/89 | NA (0.9) | ND (0.9) | ND (0.9) | 3.5 | ND (0.9) | ND (0.9) | ND (0.9) | ND (0.9) | |
| 9/12/89 | BA | NA | ND (1.8) | ND (1.8) | NA | NA | NA | NA | |
| 9/16/89 | ND (1.8) | ND (3.6) | NA | ND (3.7) | ND (3.7) | ND (3.7) | ND (1.9) | ND (1.8) | |
| 12/15/89 | NA | NA | ND (19.5) | NA | ND (20.5) | ND (20.0) | NA | NA | |
| 3/15/90 | NA | NA | ND (1.8) | ND (1.9) | ND (1.7) | ND (1.8) | ND (1.8) | ND (1.8) | |
| 7/24/90 | ND (1.9) | ND (1.8) | ND (1.9) | ND (1.9) | 1.6 | 1.2 | 0.4 | ND (0.9) | |
| Indeno(1,2,3-cd)pyrene | 3/1/89 | 7.7 | 5.3 | 7.6 | 11 | 6 | 5.3 | 4.9 | 5.7 |
| 6/6/89 | 5.7 | 5.7 | 7.4 | 13 | 2.8 | 3.3 | 2.7 | 0.9 | |
| 9/12/89 | NA | NA | 8.7 | 2.1 | NA | NA | NA | NA | |
| 9/16/89 | 3 | ND (3.6) | NA | ND (3.7) | ND (3.7) | ND (3.7) | ND (1.9) | 4.4 | |
| 12/15/89 | NA | NA | ND (19.5) | NA | ND (20.5) | ND (20.0) | NA | NA | |
| 3/15/90 | NA | NA | ND (1.8) | 2.7 | 3.6 | 3.8 | 4 | 3.6 | |
| 7/24/90 | 7.6 | 7.5 | 6.4 | 7.4 | 6.1 | 4.7 | 2.8 | 4.2 | |
| TCIC(b) | 3/1/89 | 258 | 103 | 201 | 255 | 161 | 126 | 186 | 167 |
| 6/6/89 | 73 | 46 | 147 | 478 | 73 | 63 | 65 | 45 | |
| 9/12/89 | NA | NA | 120 | 15 | NA | NA | NA | NA | |
| 9/16/89 | 71 | 95 | NA | 44 | 111 | 111 | 49 | 88 | |
| 12/15/89 | NA | NA | 72 | NA | 18 | 41 | NA | NA | |
| 3/15/90 | NA | NA | 25 | 36 | 59 | 57 | 51 | 54 | |
| 7/24/90 | 59 | 75 | 77 | 92 | 57 | 34 | 23 | 27 | |
ND - Not detected. Number in parentheses is the minimum quantitation limit.
NA - Sample was not collected from this subplot since the concentration of TCICs in the sample collected during the previous sampling event was less than the 100 mg/kg cleanup standard.
(a) Second and third lifts of soil had been applied to the LTA prior to the 09/16/89 and 03/15/90 sampling events, respectively. The second lift of soil was applied to all subplots, except Subplot C. The third lift of soil was applied to all subplots, except Subplots A and B.
(b) TCIC equals sum of concentrations for chrysene, benzo(a)anthracene, benzo(b)fluoranthene, benzo(a)pyrene, dibenzo(a,h)anthracene, and indeno(1,2,3-cd)pyrene.