 |
Cost and Performance
Report:
|
Preparation of this report has been funded wholly or in part by the U.S. Environmental Protection Agency under Contract Number 68-W3-0001. It has been subject to administrative review by EPA headquarters and Regional staff and by the technology vendor. Mention of trade names for commercial products does not constitute endorsement or recommendation for use.
This report presents cost and performance data for a soil vapor extraction (SVE) system at the Tank 2 Operable Unit, Sacramento Army Depot (SAAD) Superfund site in Sacramento, California. SVE was used at the Tank 2 Operable Unit to treat soil contaminated with volatile organic compounds (VOCs).
The Tank 2 Operable Unit at SAAD was the location of an underground storage tank (Tank 2) used to store waste solvents. Release of waste solvents from the tank to the surrounding subsurface was suspected. The results of a subsequent remedial investigation (RI) indicated that approximately 650 cubic yards of soil surrounding Tank 2 were contaminated. Ethylbenzene, 2-butanone, tetrachloroethene, and xylenes were the primary constituents detected in soil at levels ranging from 0.005 to 11,000 mg/kg.
A Record of Decision (ROD) addressing the Tank 2 Operable Unit was signed in December 1991 and specified soil cleanup levels for ethylbenzene, 2-butanone, tetrachloroethene, and xylenes. The ROD also specified that these cleanup levels must be achieved within six months of system operation, as verified by confirmatory soil sampling. SVE was selected for remediating soil in the Tank 2 Operable Unit because it was determined to be the most cost effective of the remedial alternatives considered.
The SVE system used for this application consisted of eight vacuum extraction wells, a positive- displacement blower, a vapor-liquid separator, and primary and secondary carbon adsorption units.
The system was operated for approximately 102 days from August 6, 1992 until January 21, 1993. During that time, approximately 2,300 total pounds of VOCs were removed. Confirmatory soil boring data, collected in March 1993, indicated that the soil cleanup levels specified in the ROD were achieved for this application.
A problem encountered during this treatment application was the unexpected extraction of significant amounts of Freon 113 (approximately 1,800 pounds of the total 2,300 pounds of total VOCs removed consisted of Freon 113). The presence of Freon 113 in soil at the Tank 2 Operable Unit was not identified during the RI prior to system operation and required the use of additional carbon.
The total costs for this application, excluding costs for construction management and Title II services, were $556,000. These costs were higher than originally estimated. This was attributed to the presence of Freon 113 which caused the quantity of carbon required for this application to exceed the original estimate. The actual total cost was adjusted to show a calculated cost for treatment of soil without including the costs attributed to the Freon. The adjusted cost was $290,000, which corresponds to $450/cubic yard of soil treated.
Table of Contents | Forward to Site Information
Sacramento Army Depot
Sacramento, California
Operable Unit # 3 (Tank 2)
CERCLIS #: CA0210020780
ROD Date: 12/9/91
Type of Action: Remedial
Treatability Study Associated With Application? Computer model of SVE
EPA SITE Program Test Associated With Application? No
Operating Period: 8/6/97 - 1/21/93
Quantity of Soil Treated During Application: 650 cubic yards (as reported
by the vendor, consisting of an area 25 by 35 feet deep)
Historical Activity That Contributed to Contamination at the Site:
Metal-plating and painting operations, leaking underground storage tank
Corresponding SIC Codes:
3471: Electroplating, Plating, Polishing, Anodizing, and Coloring
3479: Coating, Engraving, and Allied Services, Not Elsewhere Classified
Waste Management Practices That Contributed to Contamination: Underground
Storage Tank
Site History: The Sacramento Army Depot (SAAD) is a 485-acre U.S. Army support facility, located in Sacramento, California, as shown on Figure 1. Current and historical operations conducted at the facility include electro-optics equipment repair, emergency manufacturing of parts, shelter repair, metal plating and treatment, and painting. In conjunction with these operations, the Army maintains unlined oxidation lagoons and burn pits, a battery disposal area, areas designated for mixing pesticides, and a firefighter training area. [1]
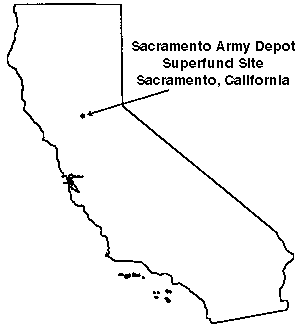
Figure 1. Site Location
In 1978 and 1979, the U.S. Army Toxic and Hazardous Materials Agency (USATHMA) identified several areas at SAAD, based on historical data, where the use, storage, treatment, and disposal of toxic substances may have contributed to contamination of soil and/or groundwater. In 1981, the Army and the California Central Valley Regional Water Quality Control Board (CVRWQCB) conducted investigations of soil and groundwater in the areas identified by USATHMA. The groundwater under the southwest corner of SAAD was determined to be contaminated with volatile organic compounds (VOCS) with the burn pits suspected as the main source of groundwater contamination. These investigations also identified six other potential areas of contamination (Figure 2): the Tank 2 area, the oxidation lagoons, the Building 320 leach field, the pesticide mix area, the firefighter training area, and the battery disposal well. Operable units were defined for each of these areas of contamination. The groundwater contamination was addressed in a 1989 Record of Decision (ROD) and the other operable units will be addressed in subsequent RODs. [1]
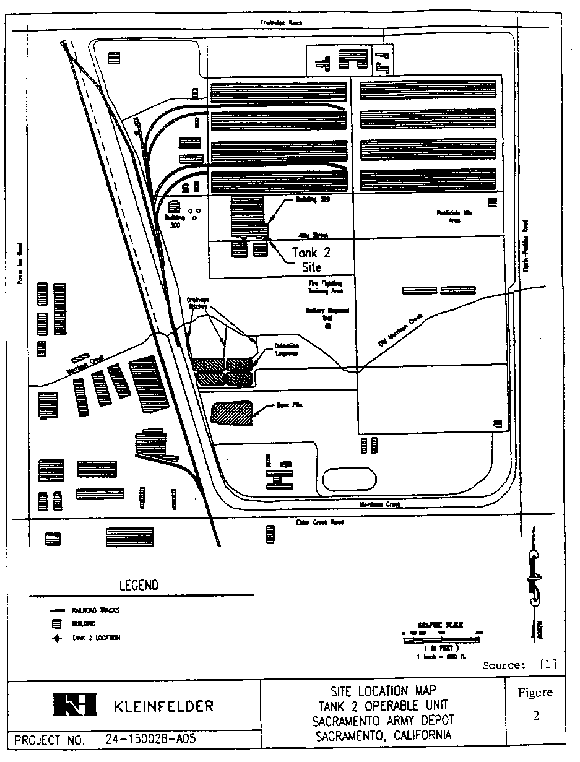
Figure 2. Site Layout [1]
The Tank 2 Operable Unit was addressed in a 1991 ROD as Operable Unit #3 and is the subject of this report. As shown on Figure 2, the Tank 2 Operable Unit is located approximately at the center of the SAAD facility. This operable unit previously contained a 1,000-gallon underground storage tank (UST) used to store waste solvents until 1980. The UST, which was emptied in 1980 and removed in 1986, showed signs of deterioration indicating a possible release to the subsurface. The Army subsequently contracted Kleinfelder, Inc. to conduct a remedial investigation (RI) and an operable unit feasibility study (OUFS) to determine the extent of contamination and identify alternatives for cleaning up soil at the Tank 2 Operable Unit. The results of the RI indicated that the soil around the UST was contaminated with VOCs but that the VOCs had not migrated to the groundwater. Ethylbenzene, xylenes, 2-butanone, and tetrachloroethene were the primary contaminants detected during the RI. Figures 3 and 4 show the location of soil contamination in a plan view and cross section of the Tank 2 Operable Unit. The results of the OUFS, completed in 1991, indicated that soil vapor extraction (SVE) was the most appropriate technology for remediating soil in the Tank 2 Operable Unit [1].
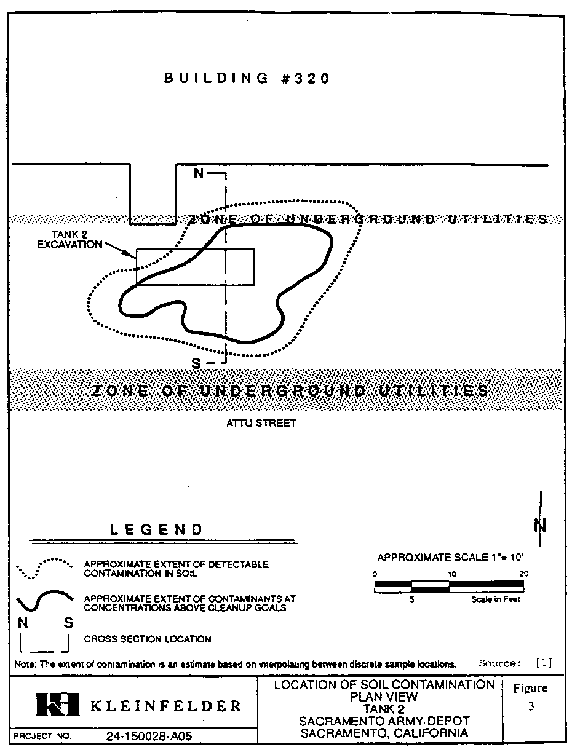
Figure 3. Soil Contamination - Plan View [1]
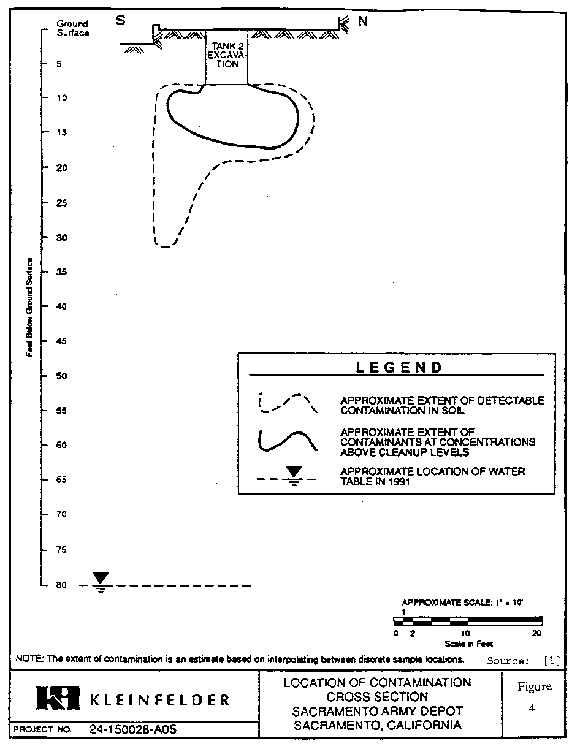
Figure 4. Soil Contamination - Cross Section
Regulatory Context: During the 1980s, EPA and the California Department of Health Services (DHS) became involved in the investigations conducted at SAAD by the U.S. Army and the CVRWQCB. The SAAD facility was subsequently placed on the National Priorities List (NPL) on August 21, 1987. In 1988, the U.S. Army, EPA, and the State of California entered a Federal Facilities Agreement (FFA). Under the FFA, the U.S. Army was the lead agency responsible for implementing the environmental response activities at SAAD.
A ROD, signed in 1991, specified treatment of soil using SVE, dehumidifying the contaminated air stream using a moisture separator, treating the contaminated air stream from the moisture separator using carbon adsorption, and treating water from the moisture separator in an on-site ultraviolet-hydrogen peroxide treatment plant. The ROD also specified the following cleanup levels for the treated soil:
These cleanup levels were developed based on the results of a public health evaluation (PHE) performed as part of the OUFS and correspond to risk reductions of 92, 99, 97, and 98 percent for 2-butanone, tetrachloroethene, ethylbenzene, and total xylenes, respectively [1].
In addition, the ROD specified that the cleanup levels must be achieved within six months of system operation as verified by confirmatory sampling of soil in the Tank 2 Operable Unit [1].
Remedy Selection: The ROD identified eight alternatives as remedial alternatives considered for the Tank 2 Operable Unit:
The ROD identified SVE, air emission control by carbon adsorption, and on-site water treatment as the selected remedy for the Tank 2 Operable Unit. This remedy was selected because it was the most cost effective of the alternatives considered.
Site Management: U.S. Army - Lead
Oversight: EPA
Remedial Project Manager:
Marlin Mezquita
U.S. EPA Region 9
75 Hawthorne Street
San Francisco, CA 94105
(415) 744-2393
U.S. Army Facility Project Manager:
Dan Obern (primary contact for this application)
Sacramento Army Depot
8350 Fruitridge Road
Sacramento, CA 95813-5052
(916) 388-2489
U.S. Army Corps of Engineers Project Manager:
George Siller
U.S. ACE, Sacramento District
1325 J Street
Sacramento, CA 95814-2922
Treatment Vendor:
James A. Perkins
Terra Vac, Inc.
14798 Wicks Blvd.
San Leandro, CA 94577
(510) 351-8900
Back to Executive Summary |
Table of Contents | Forward to Matrix Description
Type of Matrix Processed Through the Treatment System: Soil (in situ)
Primary Contaminant Groups: Volatile organic compounds (VOCs)
During the RI, samples were collected from 15 soil borings in
the Tank 2 Operable Unit and analyzed for VOCs, polynuclear aromatic
hydrocarbons, and pesticides. The primary constituents of concern were
2-butanone, ethylbenzene, tetrachloroethene, and xylenes. As shown in Table 1,
ethylbenzene and xylene were detected in 13.3 and 21.0 percent of the samples
analyzed, respectively, and at maximum concentrations of 2,100 and
11,000 mg/kg, respectively. The constituents 2-butanone and
tetrachloroethene were detected in 4.8 and 5.7 percent of the samples
analyzed, respectively, and at maximum concentrations of 150 and 390 mg/kg,
respectively. [1]
Table 1. Subsurface Soil Contamination Levels in the Tank 2 Operable Unit. [1]
| Constituent | Total Number of Samples Analyzed | Percent of Times Detected | Range of Detected Concentrations (mg/kg) |
|---|---|---|---|
| 2-Butanone | 105 | 4.8 | 0.011 to 150 |
| Ethylbenzene | 105 | 13.3 | 0.006 to 2,100 |
| Tetrachloroethene | 105 | 5.7 | 0.006 to 390 |
| Xylenes | 105 | 21.0 | 0.005 to 11,000 |
The major matrix characteristics affecting cost or performance for this technology and their measured values are listed in Table 2. [5]
The following additional matrix characteristics were measured [5]:
Unit weight, dry: 94.0 to 98.1 lbs/ft3 pH: 7.0 to 7.8 Nitrate as N: 2.7 to 3.8 mg/g Kjeldahl nitrogen as N: 15.2 to 91.4 mg/kg Cation exchange capacity: 20.2 to 118 milliequivalents per 100 grams (as Na) Chemical oxygen demand: 500 to 5,750 mg/kg
Table 2. Matrix Characteristics [5, 6, 7]
| Parameter | Value | Measurement Method |
|---|---|---|
| Soil Classification | Silt | USCS Field Determination |
| Clay Content | <30% | Laser Particle Analysis |
| Particle Size Distribution | 2.5-10 F | Laser Particle Analysis |
| Moisture Content | 25.6 to 26.5% | Dean-Stark |
| Air Permeability | 1.7 × 10⁷ to 6.2 × 105 cm/sec | API PR 40 @ 25psi |
| Porosity | 44.3 - 45.8% | -- |
| Total Organic Carbon | 0.011 to 0.44% | Not available |
| Nonaqueous Phase Liquids | Not Detected | Dean-Stark |
Site Geology/Stratigraphy
The soil underlying the Tank 2 Operable Unit generally consists of soil and clay with embedded units of sand and silty sand. Figures 5 and 6 show the A-A' and B-B' geologic cross-sections for the Tank 2 Operable Unit, respectively. These cross-sections were prepared based on the logs for 15 soil borings completed in the Tank 2 Operable Unit during the RI. Figure 7 shows the locations of these borings within the Tank 2 Operable Unit. Boring logs for borings TT-1, TT-3, TT-5, TT-10, TT-11, TT-12, and TT-13 indicate that:
The logs for borings TT-1, TT-2, TT-5, and TT-8 indicate that a unit of very stiff to hard clayey-silt is present 26 to 29 feet below the ground surface. This unit contains trace amounts of fine sand and does not appear to be laterally continuous since it is not present in borings TT-3, TT-6, TT-7, and TT-10 through TT-15. [5]
The depth to groundwater beneath the Tank 2 Operable Unit is approximately 80 feet below the ground surface. [5]
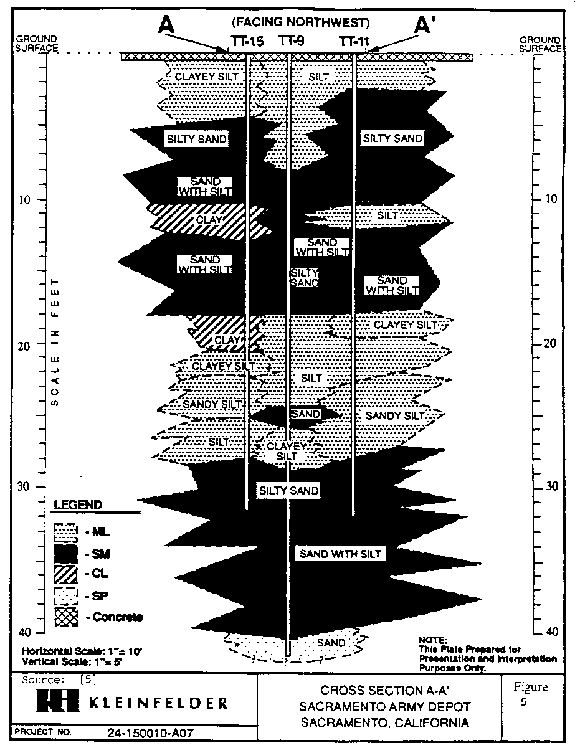
Figure 5. Cross-Section A-A' [5]
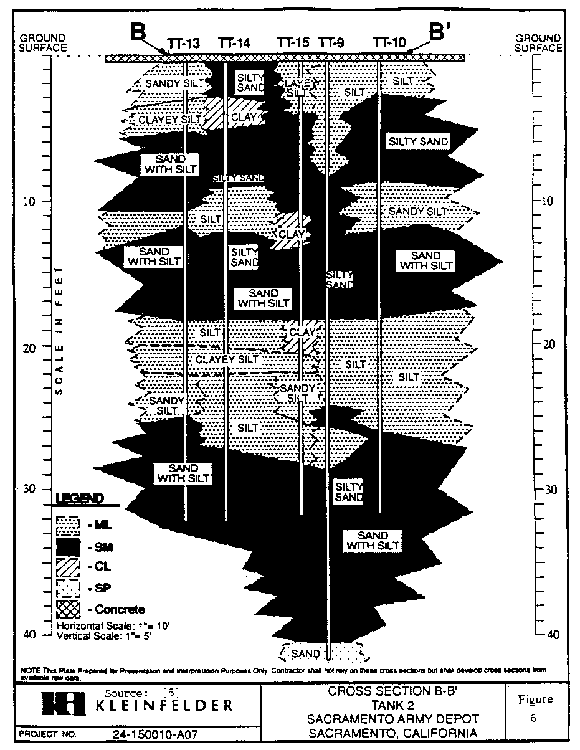
Figure 6. Cross-Section B-B' [5]
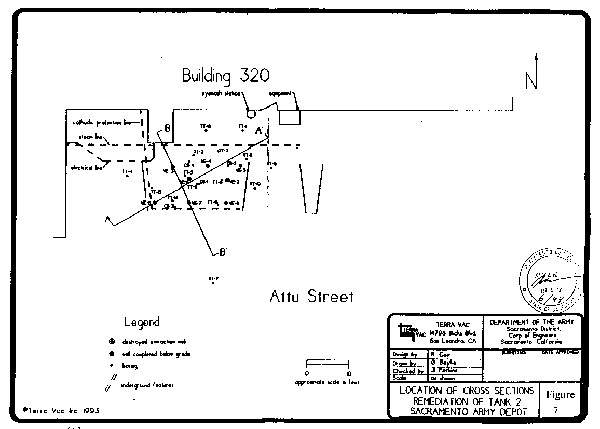
Figure 7. Cross-Section Locations [5]
Back to Site Information | Table of Contents | Forward to Treatment System Description
Soil vapor extraction
Post-treatment of vapors: moisture separator, carbon adsorption
System Description
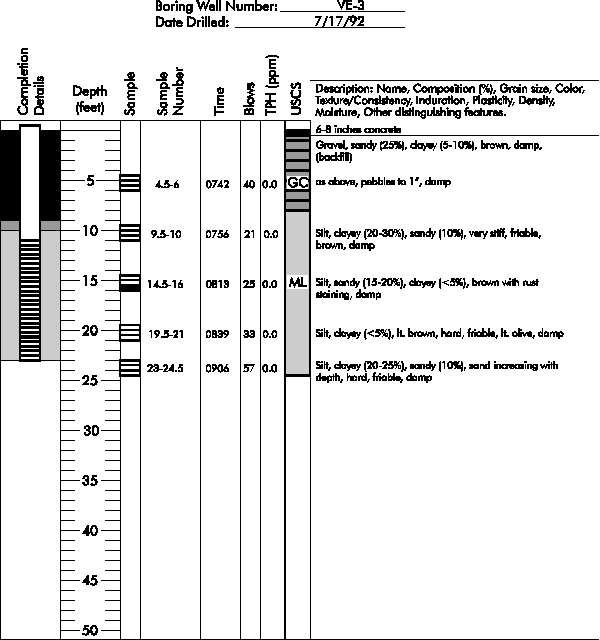
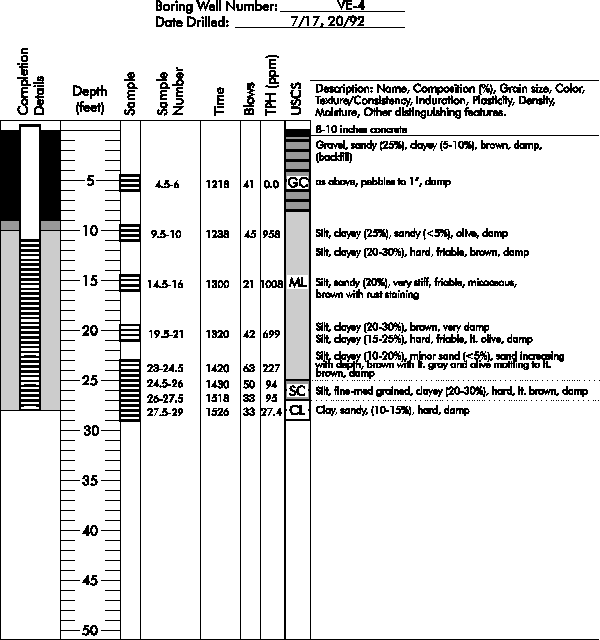
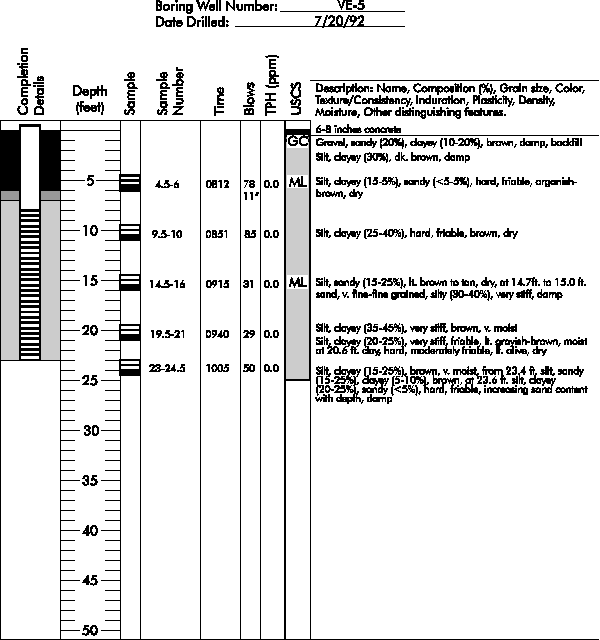
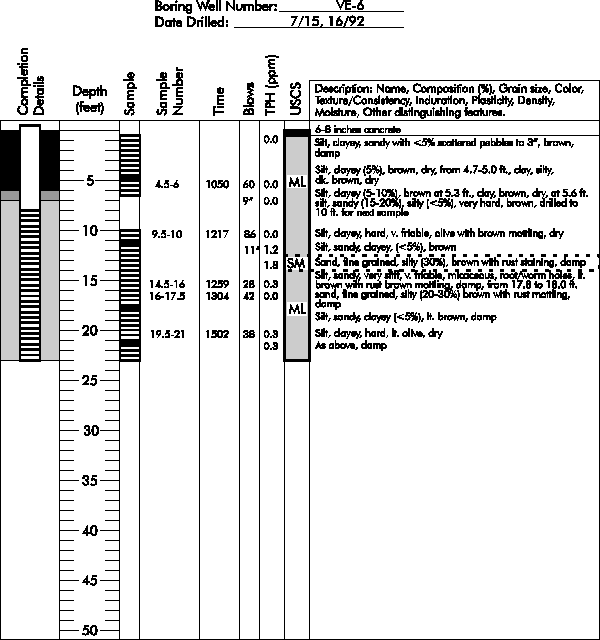
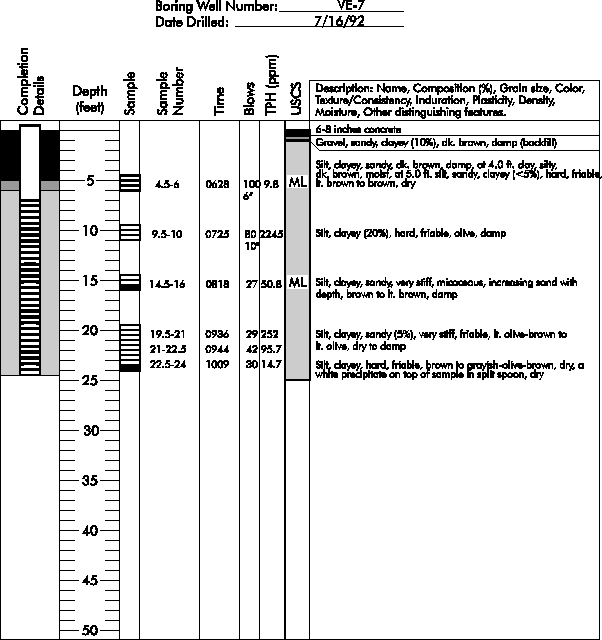
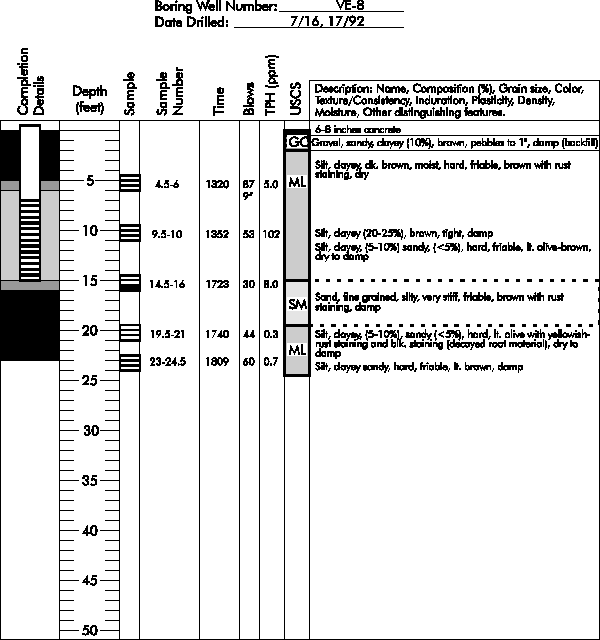
The SVE system used at the Tank 2 Operable Unit consisted of eight vacuum extraction wells (VE-1 through VE-8), a positive displacement blower, a vapor-liquid separator, and primary and secondary carbon filters, as shown on Figure 8. This system was designed by the vendor to remove approximately 1,650 pounds of ethylbenzene and xylene (based on RI results) within the six month period specified in the ROD. Wells VE-1 and VE-2 were installed and operated during a treatability study and were used for the full-scale treatment application. These wells were installed to a depth of 18 feet below the ground surface. Wells VE-3 through VE-8 were installed during July 1992, just prior to system start-up on August 6, 1992, at depths ranging from 15 to 28 feet below the ground surface. Appendix B contains the boring logs for these extraction wells showing the exact completion depth and presenting information on the specific materials of construction for each well. [2]
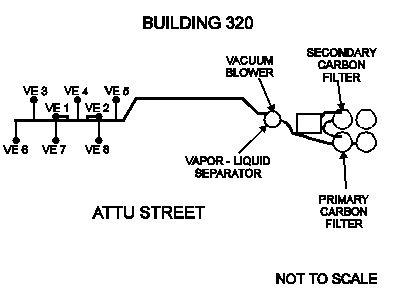
Figure 8. SVE Plot Plan [2]
Eight vacuum extraction wells were required at the relatively small site due to the low permeability of site soils and the schedule. The ROD specified that the cleanup had to be completed within 6 months after initiation. The large number of wells were required to meet the schedule. [9]
The soil cuttings generated when wells VE-3 through VE-8 were drilled were placed in a lined box. The box was piped into the SVE system so that the cuttings could be treated. Wells VE-1 through VE-8 and the box containing the soil cuttings were connected to a 30-horsepower positive displacement blower by above-ground distribution piping. [2]
Vapors extracted using the vacuum extraction wells were treated using a vapor-liquid separator and carbon adsorption units. The vapor first passed through the vapor-liquid separator where entrained water was separated from the vapor and stored for future treatment in the ultraviolet-hydrogen peroxide treatment plant operated at SAAD. A total of 70 gallons of water were generated during the treatment application. The vapor from the vapor-liquid separator then passed through 1,000-pound primary and secondary carbon units that were placed in series. A total of 33,000 pounds of spent carbon were generated during the treatment application. Treated vapor from the secondary carbon unit was vented to the atmosphere. [2]
The vacuum extraction wells were installed and the SVE system was assembled at the site in July 1992. The SVE system was operated at the Tank 2 Operable Unit from August 6, 1992 until January 21, 1992 for a total of 102 days. Confirmatory samples were collected on March 22 and 23, 1993. The results of these samples indicated that the cleanup levels had been achieved. The SVE equipment was demobilized and the site restored between March and April 1993. Site restoration activities included off-site disposal of the treated soil from well borings, and destroying wells VE-1, VE-2, VE-4, VE-5, VE-6, and VE-8. Wells VE-3 and VE-7 were completed below grade and, therefore, were left open.
On January 21, 1993, extraction was stopped because the rate of extraction of target compounds had been decreased to less than 0.01 pounds per day. To determine the residual amounts of target contaminants, the system was shut down for five days. On January 26, the system was started up again and the rate of extraction of target contaminants was measured. The target contaminants were still being extracted at less than 0.01 pounds per day. Since the extraction rates of target contaminants remained low, the system was shut down.
Shortly after system start-up, the treatment vendor discovered that the SVE system was extracting significant amounts of Freon 113, in addition to the contaminants of concern. Approximately 50 pounds per day of Freon 113 were being extracted from the wells. Vapor concentrations data indicated that most of the Freon 113 was being extracted from beneath Building 320, located at the North end of the site. The unexpected extraction of Freon 113 caused an increase in the carbon utilization rate above what the vendor had estimated prior to operating the system. In response, the vendor performed several activities to decrease the amount of Freon 113 extracted from the wells:
On December 16, 1992, wells VE-3, VE-4, and VE-5 were put back on line to determine residual Freon levels. The amount of extracted Freon had dropped to between 10 and 18 pounds per day.
The major operating parameters affecting cost or performance for this technology and their values measured during this treatment application are listed in Table 3. Information on daily air flow rates is presented in Appendix B. [2]
Table 3. Operating Parameters [2]
| Parameter | Value | Measurement Method |
|---|---|---|
| Air Flow Rate | 16 to 365 scfm | Not available |
| Vacuum | Not available | -- |
The timeline for this application is presented in Table 4.
Table 4. Timeline [2]
| Start Date | End Date | Activity |
|---|---|---|
| 7/22/87 | -- | SAAD added to National Priorities List |
| 12/9/91 | -- | ROD signed. |
| 7/13/92 | 8/3/92 | Vacuum extraction wells installed and SVE system assembled. |
| 8/6/92 | 10/29/92 | SVE system operated. |
| 10/29/92 | 11/13/92 | System shut down so that air injection test could be performed. |
| 11/13/92 | 11/25/92 | SVE system operated. |
| 11/25/92 | 12/14/92 | SVE system shut down to attempt installation of vent probes. |
| 12/14/92 | 12/25/92 | SVE system operated with wells VE-1, VE-2, VE-4, and VE-5 on line. |
| 12/25/92 | 1/4/93 | SVE system shut down due to equipment failure. |
| 1/4/93 | 1/21/93 | SVE system operated. |
| 1/21/93 | 1/25/93 | SVE system shut down to prepare for start-up spike test. |
| 1/26/93 | -- | Start-up spike test performed. No spike detected. |
| 1/25/93 | 3/22/93 | Drilling plan for confirmatory soil borings reviewed and approved. |
| 3/22/93 | 3/23/93 | Confirmatory soil samples collected. |
| 3/23/93 | 4/22/93 | Equipment demobilized and site restored. |
Back to Matrix Description | Table of Contents | Forward to Treatment System Performance
The 1991 ROD specified the following cleanup levels for the treated soil at the Tank 2 Operable Unit [1]:
The ROD specified that these cleanup levels were to be achieved by removing VOCs using an SVE system with a moisture separator, activated carbon unit, and ultraviolet-hydrogen peroxide water treatment plant. Additionally, the ROD specified that the cleanup levels were to be achieved within approximately six months of system operation.
The cleanup levels for the four constituents were developed based on the results of a public health evaluation performed as part of the OUFS. The cleanup levels for 2-butanone, ethylbenzene, tetrachloroethene, and xylenes result in estimated 92, 97, 99, and 98 percent reductions in human health risks, respectively.
Ambient air standards were based on a 10-6 health risk criterion. [11]
Confirmatory soil sampling was conducted at the Tank 2 Operable Unit on March 22 and 23, 1993 to assess whether the cleanup levels specified in the ROD had been achieved. Four soil borings were completed in the Tank 2 area and are referred to as confirmatory borings (CB). Figure 7 shows the locations of CB-1 through CB-4 in the Tank 2 Operable Unit. Three samples were collected from each boring; one from an interval 9-10.5 feet below the ground surface, one from 12-13.5 feet below the ground surface, and one 15-16 feet below the ground surface. These samples were analyzed for 2-butanone, ethylbenzene, tetrachloroethene, and xylenes using EPA Method 8240. The samples were also tested for Freon 113.
2-Butanone was detected in samples collected from borings CB-1, CB-2, and CB-4 at concentrations of 0.0038, 0.003, and 0.0051 mg/kg, respectively. Ethylbenzene was detected in one sample collected from CB-4 at a concentration of 0.021 mg/kg. Total xylenes were detected in two samples collected from CB-4 at concentrations of 0.018 and 0.140 mg/kg. Tetrachloroethene and Freon 113 were not detected in any of the samples collected from borings CB-1 through CB-4. The results of these samples are presented in Table 5.
Additionally, vapor samples were collected throughout the operation of the SVE system at the Tank 2 Operable Unit and measured for VOCs using direct injection into a gas chromatograph. The results for these samples, along with air flow measurements collected during system operation, were used to estimate the mass of VOCs removed and the extraction rates for VOCs.
Figure 9 shows the mass of total VOCs, Freon 113, and non-Freon VOCs removed during system operation. Approximately 2,300 pounds of total VOCs, 1,800 pounds of Freon 113, and 500 pounds of non-Freon VOCs were extracted during this application. Figure 10 shows the extraction rates of total VOCs, Freon 113, and non-Freon VOCs during system operation. The extraction rates ranged from approximately 5 to 120 pounds per day of total VOCs, 5 to 80 pounds per day of Freon 113, and 0 to 110 pounds per day of non-Freon VOCs during this application. The data used to generate these plots is contained in Appendix B.
Ambient air sampling was performed during intrusive work, such as construction and drilling, and also periodically during routine operation. The ambient air standards were met, as no emissions were detected by the monitoring devices.
As shown in Table 5, the cleanup levels specified in the ROD were achieved for the four specified constituents within the required six months of system operation. 2-butanone, ethylbenzene, tetrachloroethene, and total xylenes were not detected in 82 percent of the confirmatory soil samples.
Table 5. Results for Confirmatory Soil Borings [2,7]
| Boring No. | CB-1 | CB-2 | CB-3 | CB-4 | |||||||||
|---|---|---|---|---|---|---|---|---|---|---|---|---|---|
| Interval (ft) | 9-10.5 | 12-13.5 | 15-16 | 9-10.5 | 12-13.5 | 15-16 | 9-10.5 | 12-13.5 | 15-16 | 9-10.5 | 12-13.5 | 15-16 | |
| Constituent | Cleanup Level (mg/kg) |
(mg/kg) |
|||||||||||
| 2-Butanone | 1.2 | 0.0038 | ND (0.005) | ND (0.005) | 0.003 | ND (0.005) | ND (0.005) | ND (0.005) | ND (0.005) | ND (0.005) | ND (0.005) | ND (0.005) | 0.0051 |
| Ethylbenzene | 6 | ND (0.005) | ND (0.005) | ND (0.005) | ND (0.005) | ND (0.005) | ND (0.005) | ND (0.005) | ND (0.005) | ND (0.005) | ND (0.005) | 0.021 | ND (0.005) |
| Tetrachloroethene | 0.2 | ND (0.010) | ND (0.010) | ND (0.010) | ND (0.010) | ND (0.010) | ND (0.010) | ND (0.010) | ND (0.010) | ND (0.010) | ND (0.010) | ND (0.010) | ND (0.010) |
| Total Xylenes | 23 | ND (0.015) | ND (0.015) | ND (0.015) | ND (0.015) | ND (0.015) | ND (0.015) | ND (0.015) | ND (0.015) | ND (0.015) | 0.018 | 0.14 | ND (0.015) |
| Freon 113 | NA | ND (0.01) | ND (0.01) | ND (0.01) | ND (0.01) | ND (0.01) | ND (0.01) | ND (0.01) | ND (0.01) | ND (0.01) | ND (0.01) | ND (0.01) | ND (0.01) |
ND=Not detected. Number in parenthesis is the reported
detection limit.
NA=Not Applicable
The highest concentration detected in these samples was total xylenes at 0.140 ppm in the sample collected from the 12-13.5 feet depth interval at CB-4.
In addition, Freon 113 was not detected in any of the samples. As shown on Figure 9, Freon 113 accounted for 1,800 of the estimated 2,300 pounds of VOCs removed during this application. As shown in Figure 10, the extraction rate for non-Freon VOCs decreased to nearly zero after approximately 78 days of operation and remained at this level until the system was shut down after 102 days. The extraction rate for Freon 113, however, remained near 15 lbs/day during this period.
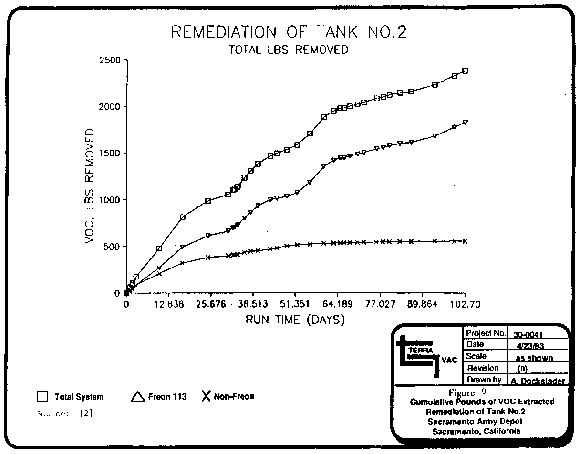
Figure 9. Cumulative Pounds of VOC Extracted [2]
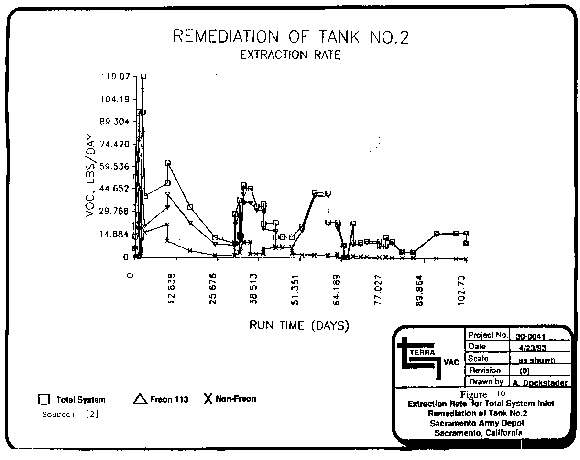
Figure 10. VOC Extraction Rates [2]
The soil boring data allow for comparison of performance of the SVE system with respect to the cleanup levels specified in the ROD. Additionally, the concentrations of VOCs and air flow were measured at the SVE system inlet for estimating the cumulative pounds of VOCs removed and extraction rates over the course of system operation.
Ten percent of the samples collected during this application, including the soil boring samples, were split and analyzed by both the contractors and the U.S. Army Corps of Engineers. No analytical concerns were reported by the Army. Soil boring samples were analyzed in accordance with EPA Method 8240 including accepted criteria for use of the method.
Back to Treatment System Description | Table of Contents | Forward to Treatment System Cost
The U.S. Army was responsible for site management during this treatment application. The U.S. Army, through the Corps of Engineers (USACE), retained Terra Vac to design, install, and operate the SVE system at the site.
Kleinfelder, Inc., provided support to the Army at SAAD under a basewide contract. Kleinfelder was responsible for completing a computer modelling treatability study of an SVE system, and collection of duplicate samples during the remediation. This model was used as a treatability study. The model predicted that an SVE system with 4 extraction wells and a volumetric flow rate of 500 cfm would reduce the concentrations of ethylbenzene and total xylenes to nondetectable levels within 6 months. [10]
Terra Vac reported a total cost of $556,000 for this application, excluding costs for construction management and Title II services.
The original contract between USACE and Terra Vac for remediation of the site was for $400,549. However, the actual cost of remediation was greater. The discrepancy between the contractual and actual costs was due primarily to the unexpected extraction of large amounts of Freon, and the corresponding increase in amount of carbon required for this application. The cost of extra carbon and its disposal are included in the "operation" cost in Table 6. [7, 8]
Table 6. Treatment Cost Elements [3]
| Cost Elements (Directly Associated with Treatment) | Actual Cost (dollars) |
|---|---|
| Mobilization/Set Up | 131,813 |
| Startup/Testing/Permits | 18,500 |
| Operation (Short Term - Up to 3 Years) | 339,694 |
| Demobilization | 65,967 |
| TOTAL TREATMENT COST | 556,000 |
Table 6 presents the costs reported by the vendor for the soil vapor extraction application at the Sacramento Army Depot Superfund Site. In order to standardize reporting of costs across projects, costs are shown in Table 6 according to the format for an interagency Work Breakdown Structure (WBS). The WBS specifies 9 before-treatment cost elements, 5 after-treatment cost elements, and 12 cost elements that provide a detailed breakdown of costs directly associated with treatment. Table 6 presents the cost elements exactly as they appear in the WBS.
As shown on Table 6, over 60% of the costs are for operation of the SVE system, including off-gas treatment using carbon (the vendor included sampling and analysis costs under operation). To estimate a cost per cubic yard of soil and per pound of contaminant treated, the costs for operation were disaggregated into a cost for treatment of Freon and non-Freon contaminants. This was done to assess the effect of the unexpectedly large amount of Freon on the calculated costs. Operating costs were assumed to be equivalent on a per unit basis for treatment of Freon and non-Freon contaminants. This approach shows that about $266,000 of the operating costs were for treatment of Freon, and $74,000 for treatment of non-Freon contaminants. Total costs for treatment of non-Freon contaminants, therefore, were $290,000, corresponding to $450 per cubic yard of soil treated and $580 per pound of non-Freon contaminant removed. The number of cubic yards of soil treated at SAAD is an estimate provided by the vendor; the actual amount of soil treated is not available at this time for comparison with the estimate.
The vendor indicated that there were no costs in this application for the following elements in the WBS: Solids Preparation and Handling, Liquid Preparation and Handling, Vapor/Gas Preparation and Handling, Pads/Foundations/Spill Control, Training, Operation (Long Term - Over 3 Years), Cost of Ownership, Dismantling, Mobilization and Preparatory Work, Site Work, Surface Water Collection and Control, Groundwater Collection and Control, Air Pollution/Gas Collection and Control, Solids Collection and Containment, Liquids/Sediments/Sludges Collection and Containment, Drums/Tanks/Structures/Miscellaneous Demolition and Removal, Decontamination and Decommissioning, Disposal (Other Than Commercial), Disposal (Commercial), and Site Restoration.
Total cost information was provided by the Army's contractor for this project. Limited information on the specific cost elements included in the total cost figure were provided by the vendor.
The vendor specified that the main factors driving the cost of SVE are soil permeabilities and the types of contaminants at the site and the schedule for final cleanup. [9]
Back to Treatment System Performance | Table of Contents | Forward to Observations and Lessons Learned
Back to Treatment System Cost | Table of Contents | Forward to References
This case study was prepared for the U.S. Environmental Protection Agency's Office of Solid Waste and Emergency Response, Technology Innovation Office. Assistance was provided by Radian Corporation under EPA Contract No. 68-W3-0001.
Back to Observations and Lessons Learned | Table of Contents | Forward to Appendix A - Operating Summary
Operating Summary
Remediation of Tank No. 2
Sacramento Army Depot [2]
| Sample Time | Operating Summary | |||||||
|---|---|---|---|---|---|---|---|---|
| Date | Hrs | Min | Sample Number** | Run Time (Days) | Flow Rate (SCFM) | Total (mg/L) | Total Rate (#/Day) | Cum VOC (lbs) |
| 05-Aug | 14 | 20 | 777 | 0.00 | 0.00 | 0.00 | 0 | |
| 05-Aug | 14 | 44 | 1 | 0.02 | 23.00 | 2.74 | 6 | 0 |
| 05-Aug | 15 | 20 | 2 | 0.04 | 20.00 | 3.30 | 6 | 0 |
| 05-Aug | 15 | 30 | 3 | 0.05 | 49.00 | 2.95 | 13 | 0 |
| 05-Aug | 15 | 55 | 4 | 0.07 | 49.00 | 4.73 | 21 | 1 |
| 05-Aug | 16 | 45 | 5 | 0.10 | 49.00 | 4.36 | 19 | 1 |
| 05-Aug | 17 | 10 | 6 | 0.12 | 97.00 | 6.05 | 52 | 2 |
| 06-Aug | 10 | 10 | 10 | 0.83 | 97.00 | 8.52 | 74 | 47 |
| 06-Aug | 11 | 0 | 12 | 0.86 | 46.00 | 18.91 | 79 | 49 |
| 06-Aug | 11 | 25 | 15 | 0.88 | 46.00 | 22.68 | 95 | 51 |
| 06-Aug | 12 | 0 | 16 | 0.90 | 46.00 | 22.93 | 96 | 53 |
| 06-Aug | 14 | 45 | 18 | 1.02 | 43.00 | 10.42 | 40 | 61 |
| 06-Aug | 15 | 0 | 19 | 1.03 | 43.00 | 9.86 | 38 | 61 |
| 06-Aug | 15 | 30 | 20 | 1.05 | 43.00 | 7.15 | 27 | 62 |
| 06-Aug | 15 | 35 | 21 | 1.05 | 46.00 | 16.61 | 68 | 62 |
| 06-Aug | 16 | 35 | 23 | 1.09 | 46.00 | 15.00 | 62 | 65 |
| 06-Aug | 16 | 40 | 24 | 1.10 | 43.00 | 9.79 | 38 | 65 |
| 06-Aug | 17 | 20 | 25 | 1.13 | 43.00 | 11.51 | 44 | 66 |
| 06-Aug | 17 | 45 | 26 | 1.14 | 43.00 | 11.93 | 46 | 67 |
| 06-Aug | 17 | 50 | 27 | 1.15 | 16.00 | 0.32 | 0 | 67 |
| 06-Aug | 18 | 50 | 28 | 1.19 | 16.00 | 0.61 | 1 | 67 |
| 07-Aug | 10 | 15 | 33 | 1.83 | 84.00 | 9.31 | 70 | 90 |
| 07-Aug | 10 | 55 | 36 | 1.86 | 32.00 | 1.56 | 4 | 91 |
| 07-Aug | 11 | 25 | 37 | 1.88 | 28.00 | 4.99 | 12 | 91 |
| 07-Aug | 11 | 55 | 38 | 1.90 | 28.00 | 5.68 | 14 | 91 |
| 07-Aug | 12 | 15 | 999 | 1.91 | 0.00 | 5.68 | 14 | 91 |
| 10-Aug | 12 | 20 | 777 | 1.91 | 0.00 | 5.68 | 14 | 91 |
| 10-Aug | 13 | 5 | 39 | 1.94 | 187.00 | 11.41 | 192 | 95 |
| 10-Aug | 15 | 10 | 40 | 2.03 | 111.00 | 12.00 | 119 | 108 |
| 10-Aug | 16 | 15 | 47 | 2.08 | 111.00 | 9.61 | 95 | 113 |
| 11-Aug | 13 | 35 | 48 | 2.97 | 121.00 | 3.65 | 40 | 173 |
| 18-Aug | 13 | 30 | 69 | 9.96 | 71.00 | 7.59 | 48 | 480 |
| 18-Aug | 14 | 5 | 73 | 9.99 | 129.00 | 5.34 | 62 | 482 |
| 25-Aug | 14 | 0 | 77 | 16.98 | 129.00 | 2.79 | 32 | 811 |
| 02-Sep | 9 | 5 | 78 | 24.78 | 130.00 | 1.10 | 13 | 988 |
| 08-Sep | 14 | 1 | 87 | 30.98 | 166.00 | 0.62 | 9 | 1056 |
| 08-Sep | 15 | 30 | 999 | 31.05 | 0.00 | 0.62 | 9 | 1056 |
| 10-Sep | 8 | 0 | 777 | 31.05 | 0.00 | 0.62 | 9 | 1056 |
| 10-Sep | 8 | 45 | 92 | 31.08 | 136.00 | 2.30 | 28 | 1057 |
| 11-Sep | 16 | 47 | 96 | 32.41 | 136.00 | 3.03 | 37 | 1100 |
| 11-Sep | 18 | 30 | 999 | 32.48 | 0.00 | 3.03 | 37 | 1103 |
| 14-Sep | 14 | 45 | 777 | 32.48 | 0.00 | 3.03 | 37 | 1103 |
| 14-Sep | 17 | 15 | 102 | 32.59 | 193.00 | 0.84 | 15 | 1106 |
| 14-Sep | 17 | 45 | 999 | 32.61 | 0.00 | 0.84 | 15 | 1106 |
| 15-Sep | 7 | 45 | 777 | 32.61 | 0.00 | 0.84 | 15 | 1106 |
| 15-Sep | 8 | 57 | 103 | 32.66 | 193.00 | 0.80 | 14 | 1107 |
| 15-Sep | 16 | 30 | 888 | 32.97 | 193.00 | 0.80 | 14 | 1111 |
| 16-Sep | 10 | 30 | 114 | 33.72 | 232.00 | 2.26 | 47 | 1134 |
| 16-Sep | 15 | 45 | 116 | 33.94 | 223.00 | 2.25 | 45 | 1144 |
| 18-Sep | 15 | 30 | 999 | 35.93 | 0.00 | 2.25 | 45 | 1234 |
| 21-Sep | 14 | 5 | 777 | 35.93 | 0.00 | 2.25 | 45 | 1234 |
| 21-Sep | 14 | 15 | 888 | 35.94 | 243.00 | 2.25 | 45 | 1234 |
| 23-Sep | 11 | 25 | 120 | 37.82 | 214.00 | 1.72 | 33 | 1307 |
| 25-Sep | 16 | 0 | 999 | 40.01 | 0.00 | 1.72 | 33 | 1380 |
| 28-Sep | 15 | 15 | 777 | 40.01 | 0.00 | 1.72 | 33 | 1380 |
| 28-Sep | 15 | 20 | 128 | 40.01 | 232.00 | 1.67 | 35 | 1380 |
| 28-Sep | 15 | 50 | 130 | 40.03 | 225.00 | 1.08 | 22 | 1380 |
| 02-Oct | 11 | 45 | 135 | 43.86 | 263.00 | 0.96 | 23 | 1466 |
| 02-Oct | 12 | 35 | 136 | 43.90 | 311.00 | 0.48 | 13 | 1466 |
| 04-Oct | 12 | 0 | 999 | 45.88 | 0.00 | 0.48 | 13 | 1493 |
| 05-Oct | 14 | 40 | 777 | 45.88 | 0.00 | 0.48 | 13 | 1493 |
| 05-Oct | 14 | 45 | 888 | 45.88 | 311.00 | 0.48 | 13 | 1493 |
| 08-Oct | 14 | 0 | 888 | 48.85 | 305.00 | 0.48 | 13 | 1532 |
| 08-Oct | 14 | 45 | 999 | 48.88 | 0.00 | 0.48 | 13 | 1533 |
| 12-Oct | 13 | 0 | 777 | 48.88 | 0.00 | 0.48 | 13 | 1533 |
| 12-Oct | 13 | 15 | 888 | 48.89 | 294.00 | 0.48 | 13 | 1533 |
| 15-Oct | 15 | 15 | 145 | 51.97 | 294.00 | 0.78 | 21 | 1585 |
| 19-Oct | 10 | 45 | 153 | 55.78 | 305.00 | 1.54 | 42 | 1705 |
| 23-Oct | 14 | 45 | 999 | 59.95 | 0.00 | 1.54 | 42 | 1881 |
| 26-Oct | 14 | 0 | 777 | 59.95 | 0.00 | 1.54 | 42 | 1881 |
| 26-Oct | 14 | 45 | 156 | 59.98 | 324.00 | 0.80 | 23 | 1882 |
| 29-Oct | 12 | 0 | 999 | 62.90 | 0.00 | 0.80 | 23 | 1949 |
| 03-Nov | 12 | 0 | 777 | 62.90 | 0.00 | 0.80 | 23 | 1949 |
| 03-Nov | 15 | 0 | 170 | 63.03 | 300.00 | 0.81 | 22 | 1952 |
| 05-Nov | 11 | 0 | 177 | 64.86 | 251.00 | 0.36 | 8 | 1979 |
| 05-Nov | 15 | 0 | 183 | 65.03 | 293.00 | 0.02 | 1 | 1980 |
| 06-Nov | 16 | 0 | 999 | 66.07 | 0.00 | 0.02 | 1 | 1980 |
| 09-Nov | 14 | 50 | 777 | 66.07 | 0.00 | 0.02 | 1 | 1980 |
| 11-Nov | 8 | 15 | 184 | 67.80 | 203.00 | 1.23 | 22 | 2000 |
| 11-Nov | 9 | 8 | 196 | 67.83 | 191.00 | 0.58 | 10 | 2001 |
| 13-Nov | 15 | 30 | 999 | 70.10 | 0.00 | 0.58 | 10 | 2023 |
| 17-Nov | 13 | 0 | 777 | 70.10 | 0.00 | 0.58 | 10 | 2023 |
| 19-Nov | 12 | 0 | 199 | 72.06 | 170.00 | 0.71 | 11 | 2043 |
| 23-Nov | 8 | 30 | 999 | 75.91 | 0.00 | 0.71 | 11 | 2085 |
| 23-Nov | 13 | 0 | 777 | 75.91 | 0.00 | 0.71 | 11 | 2085 |
| 23-Nov | 13 | 30 | 202 | 75.93 | 213.00 | 0.41 | 8 | 2085 |
| 25-Nov | 12 | 0 | 999 | 77.87 | 0.00 | 0.41 | 8 | 2100 |
| 16-Dec | 11 | 0 | 777 | 77.87 | 0.00 | 0.41 | 8 | 2100 |
| 16-Dec | 11 | 50 | 211 | 77.90 | 280.00 | 0.52 | 13 | 2101 |
| 18-Dec | 10 | 0 | 217 | 79.83 | 243.00 | 0.48 | 11 | 2124 |
| 21-Dec | 12 | 48 | 218 | 82.94 | 350.00 | 0.13 | 4 | 2146 |
| 25-Dec | 0 | 0 | 999 | 86.41 | 0.00 | 0.13 | 4 | 2160 |
| 05-Jan | 9 | 30 | 777 | 86.41 | 0.00 | 0.13 | 4 | 2160 |
| 05-Jan | 12 | 48 | 888 | 86.55 | 334.00 | 0.13 | 4 | 2161 |
| 12-Jan | 12 | 48 | 231 | 93.55 | 365.00 | 0.50 | 16 | 2232 |
| 18-Jan | 12 | 48 | 244 | 99.55 | 284.00 | 0.66 | 17 | 2331 |
| 21-Jan | 15 | 30 | 999 | 102.66 | 0.00 | 0.66 | 17 | 2383 |
| 26-Jan | 10 | 15 | 777 | 102.66 | 0.00 | 0.66 | 17 | 2383 |
| 26-Jan | 10 | 35 | 255 | 102.67 | 274.00 | 0.42 | 10 | 2383 |
| 26-Jan | 11 | 15 | 999 | 102.70 | 0.00 | 0.42 | 10 | 2383 |
* 777=Start-up; 888=No sample taken,
999=Shut-down
Back to References | Table of Contents | Forward to Appendix A - Operating Summary
