Geophysical Methods
Electrical Resistivity Tomography
Electrical Resistivity Tomography (ERT) is a well-established and versatile geophysical technique that measures the spatial distribution and contrast of electrical resistivity in the subsurface. ERT measurements can be performed along a linear surface transect, in a grid or non-linear geometry, as a vertical sounding, in a borehole, or from watercraft. The data are used to produce a two-dimensional (2-D) electrical image (a "cross section" or "plane") or three-dimensional (3-D) distribution of subsurface resistivity values, analogous to a medical CAT scan. Although there are many applications of ERT to a variety of industries, this technology area focuses on the surface line application (Figure 1).
Figure 1. Example of an Electrical Resistivity Survey Using a Fixed Linear Array.
ERT is commonly used in environmental applications to (Benson, R., et al., 1984; Atekwana, E. and E. Atekwana, 2010):
- Estimate depth, thickness, and resistivity of subsurface layers.
- Estimate depth to the water table.
- Identify boundaries of landfill and burial pit sites.
- Develop a broad, low-resolution cross section of the site.
- Reconcile boring logs from multiple drilling efforts over time and identification of data gaps requiring further investigation.
- Detect high-concentration contaminant plumes and variations in hydrogeological properties using temporal imaging.
- Detect injected amendment or microbial distribution in the subsurface.
ERT can reliably distinguish the upper four layers of discrete rock or soil types, with sufficient electrical resistivity contrast down to 100 meters (m) (Benson, R., et al., 1984) depending on the survey configuration. ERT is best applied in areas without common sources of signal interference or noise, including:
- Buried pipes, culverts, and cables.
- Metal fences and powerlines.
- Metal from nearby vehicles and buildings.
- Highly resistive ground (i.e., bedrock).
Typical Uses
Resistivity depends on mineral composition, structure of the subsurface material, porosity, and pore fluid composition, among other factors. For instance, loose sand can register between 1,000 to 100,000 Ohm-meters (Ω-m) (Everett, 2013; Benson, R., et al., 1984). Therefore, a resistivity survey works best to distinguish rock layers based on their relative resistivities. The greatest contrast in resistivity is most often seen between water-bearing and non-water-bearing geologic units. A resistivity survey is most effective at determining:
- Boundaries between subsurface layers of varying electrical properties.
- Extent of pore space saturation (depth of the water table) (Sattar, G., et al., 2016
 ).
).
Emerging uses of resistivity surveys include determining:
- Relative porosity and permeability of saturated subsurface materials based on field data and/or modeling.
- Locations of fault and fracture zones, caves, and changes in lithology (Vogelgesang, J., et al., 2020).
- Changes in the subsurface characteristics over time using time-lapse ERT. Time-lapse ERT can also help monitor changes in aquifer quality (Lapenna et al., 2022).
- Concentration of dissolved electrolytes and colloids in pore fluid (Singha, K. and S. Gorelick, 2005), which would require additional information on the geology to understand subtle differences in resistivity caused by the dissolved load in groundwater. Cross-hole ERT also has been used to increase sensitivity and resolution of these measurements with depth.
A resistivity survey can also rapidly and quantitatively reconcile different sets of qualitative boring log data. As such, a resistivity survey should always be correlated with borehole data to connect specific resistivity signatures with a particular rock or soil layer at the site.
↩Theory of Operation
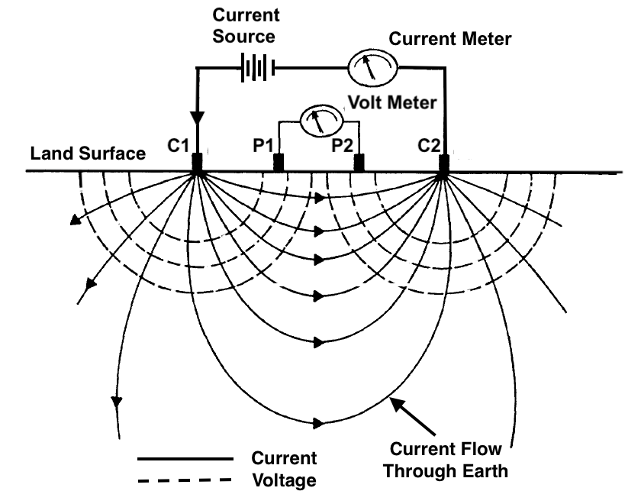
Figure 2. Simplified Wenner array setup involving a resistivity meter and four electrodes. A typical survey array employs more electrodes (Benson, R., et al., 1984).
ERT works by transmitting a direct electrical current into the ground using a pair of current electrodes (see C1 and C2 in Figure 2) and then measuring the voltage at one or more additional pairs of potential electrodes along the straight survey line (see P1 and P2 in Figure 2). With the voltage (V) and current (I) known, the equivalent resistance (R) of the earth materials surveyed can then be calculated using Ohm's Law:
$$ \frac{V}{I}=R. $$
The equivalent resistance from this calculation assumes that the subsurface materials are uniform and homogeneous. In reality, the resistivity measured by the four-electrode configuration is determined by the various lithologies and subsurface structures which may be inhomogeneous. The applied current can take several paths through the subsurface. The inversion algorithm compares voltage readings for different electrode spacings to assign an "apparent resistivity" value to a particular depth (Everett, 2013; Benson, R., et al., 1984). The geometry of the electrode spacing is an important factor in the design, analysis, and interpretation of an ERT survey. Resistance meters typically measure a resistance value, R as described in the above equation. Apparent resistivity is then calculated by multiplying this resistance by a geometric factor:
$$ p_a=\mathbf{k V} / \mathbf{I} $$
where pa is the apparent resistivity and k is the geometric factor based on the spacing of the participating electrodes (Loke, M.H.,1999![]() ).
).
Many electrode array configurations (the spacing of electrodes and their relative positions) may be used, but the most common arrays are the Wenner, Schlumberger, and dipole-dipole. The depth of measurement is controlled by the electrode spacing of the array (Table 1). As the spacing is increased, greater depths of measurement are reached. A survey length with maximum spacing of three to four times to depth of interest is recommended to adequately characterize layers at depth (Benson, R., et al., 1984; Wightman, W.E., et al., 2003). In general, when electrodes are closer together, more of the current travels through shallower layers, and when electrodes are further apart, more of the current travels through deeper layers (Benson, R., et al., 1984; Wightman, W.E., et al., 2003; Everett, 2013).
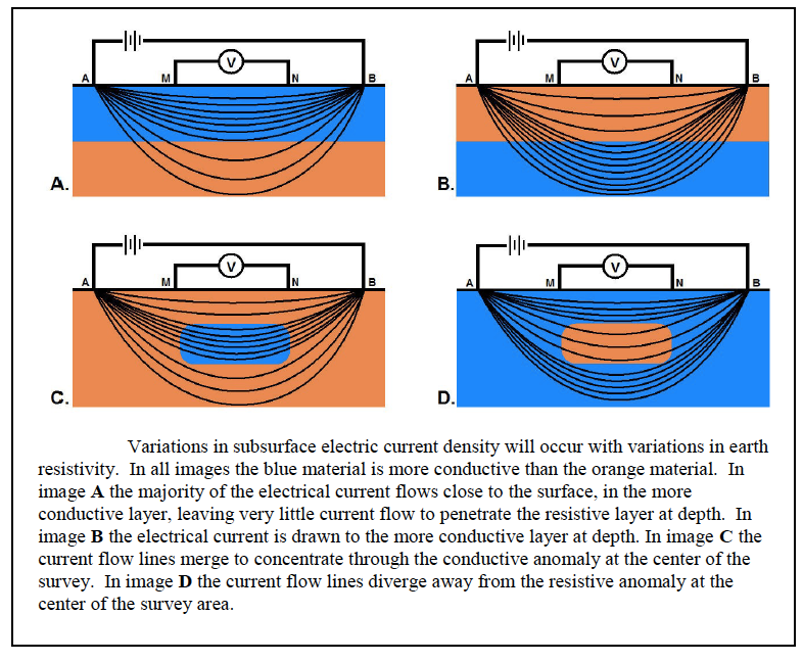
Figure 3. Illustration of how heterogeneities affect current flow in the subsurface (Pierce, K., et al., 2012![]() ).
).
The path the applied electrical current takes in the subsurface will deviate from the theoretical movement of the applied electrical current, as shown in Figure 2. One complicating factor is that electrical current prefers to take the path of least resistance (Figure 3). As the number of discrete layers increases and horizontal heterogeneities emerge (Figure 3C and 3D), the current's path becomes more convoluted, and the algorithm can return numerous solutions if not bound by sufficient borehole log data or other geophysical data (Pierce, K., et al., 2012![]() ; Wightman, W.E., et al., 2003).
; Wightman, W.E., et al., 2003).
System Components
The typical components of a surface resistivity survey are 18-inch metal stake electrodes, 20- to 100-meter cables, clamp connectors, and a resistivity meter that needs to be programmed before the survey and powered during the survey (usually with a portable battery). In addition, bentonite clay and water or saltwater may be required to improve ground contact with the electrodes, particularly in arid regions, to reduce "contact resistance." High-contact resistance values between the ground and the electrodes will eliminate or significantly alter resistivity readings (Everett, 2013; Herman, R., 2001![]() ). After the survey, an inversion of the data, and visualization software is used to create the resistivity cross section. More information on the inversion software is discussed in Data Display and Interpretation.
). After the survey, an inversion of the data, and visualization software is used to create the resistivity cross section. More information on the inversion software is discussed in Data Display and Interpretation.
Modes of Operation
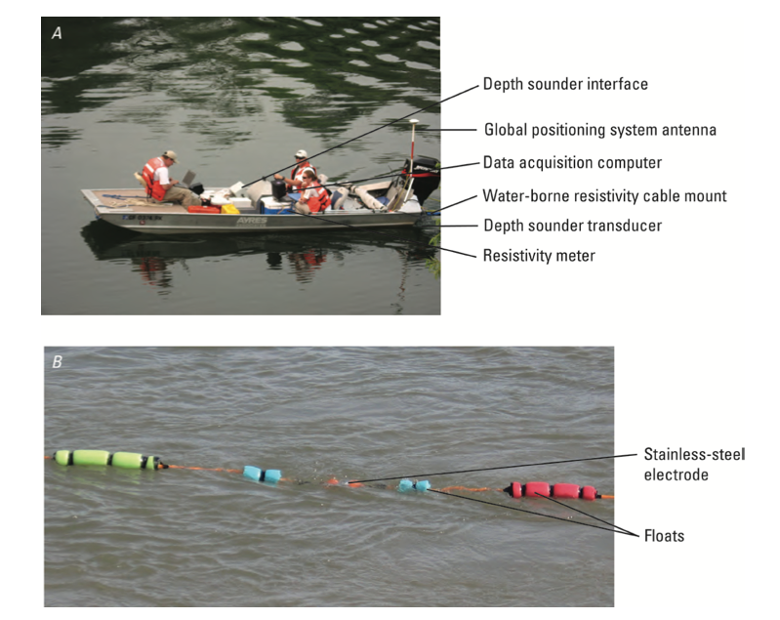
Figure 4. Waterborne survey example: A, the boat with the resistivity and auxiliary equipment, and B, the cables with electrodes and floats (Ball, L., and A. Teeple, 2013).
This section focuses on the surface application of ERT, but electrical resistivity data also can be collected beneath water bodies using watercraft (Ball, L. and A. Teeple, 2013![]() and Belaval, M., et al., 2003
and Belaval, M., et al., 2003![]() ) (Figure 4) and from the subsurface via boreholes. Detailed data at depth in the subsurface can be collected from a single borehole (USGS, 2018 and ITRC, 2019), cross-hole (USGS, 2016), or as a borehole-surface deployment where open spaces for surface deployment are limited (Vilar et al., 2015
) (Figure 4) and from the subsurface via boreholes. Detailed data at depth in the subsurface can be collected from a single borehole (USGS, 2018 and ITRC, 2019), cross-hole (USGS, 2016), or as a borehole-surface deployment where open spaces for surface deployment are limited (Vilar et al., 2015![]() ).
).
A typical resistivity 2-D imaging survey involves two cables extending from the resistivity meter in opposite directions. The field crew stakes electrodes 12 inches into the ground and connects them to the cables. Typically, the electrodes are spaced 5 or 10 meters apart. A particular "array," or electrode configuration, must be programmed into the resistivity meter. The Schlumberger and Wenner arrays are frequently used for imaging since they are sensitive to vertical variations in subsurface resistivity and less affected by noise, though less sensitive to horizontal variations.
Surveys are conducted in a sounding mode, profile mode, or both. In sounding mode, the distance between electrodes is increased while the center of the array stays in the same location. The sounding mode is used to gather resistivity data with depth. In the profile mode, the relative position of the electrodes stays the same in the array. The entire array is moved along a transect, collecting resistivity data at regular intervals. The profile mode is used to gather lateral variations in resistivity. Surveys using multi-electrode arrays in various sounding and profile combinations are possible with modern programmable ERT equipment. This allows the automatic collection of many readings from any number of electrodes (National Research Council [NRC], 1996).
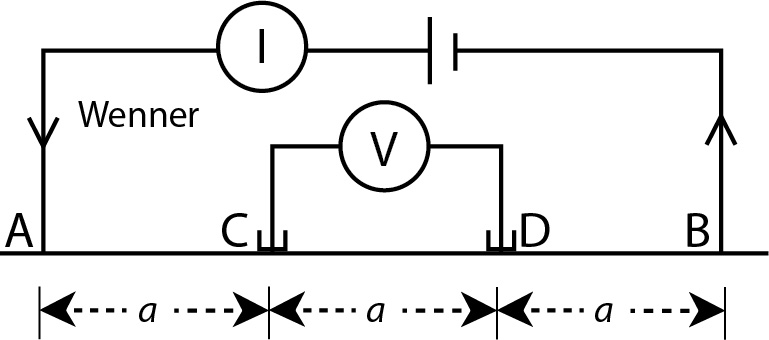
The Wenner array (Table 1) is configured for lateral profiling to collect resistivity data with a constant depth of investigation. The current electrodes (C1 and C2) and potential electrodes (P1 and P2) have a fixed distance of separation a between the electrodes. Apparent resistivity is collected as the array is shifted along the profile line. The depth of investigation depends on the spacing a between the electrodes. As a increases, the electric current travels deeper into the subsurface (Everett, 2013).
The Schlumberger array (Table 1) is configured for vertical resistivity sounding. A resistivity profile at depth is collected beneath one location. The potential electrodes (P1 and P2) are kept at a fixed location with a constant separation a. The current electrodes (C1 and C2) are separated from the midpoint by a distance na. Successive voltage readings are collected as the separation of C1 and C2 increase beyond the center point. As the distance between C1 and C2 increases, the current travels to greater depths in the subsurface (Everett, 2013).
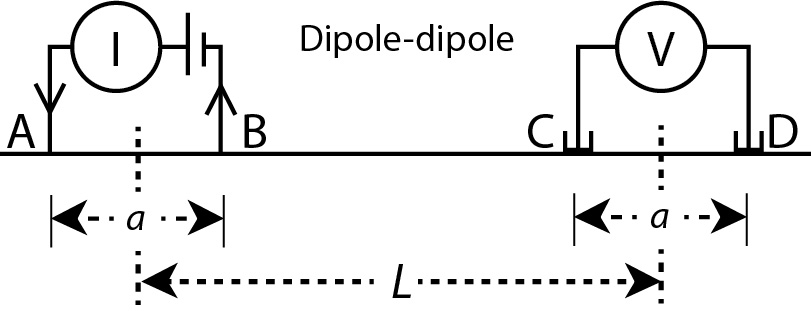
In the dipole-dipole array (Table 1), both the current electrodes pair (C1 and C2) and the potential electrode pair (P1 and P2) are separated from each other by distance a. However, the distance between the two pairs (na) is much greater. The dipole-dipole array can be used for both sounding and profiling, though it is more sensitive to horizontal changes in resistivity and relatively insensitive to vertical changes. This array has a shallower depth of investigation than the Wenner array, but is better for horizontal profiling. At large values of n, the signal strength and quality decrease relative to the noise level. In addition, the measurement of voltage across the potential electrodes (P1 and P2) may be distorted by small-scale heterogeneities located near the surface (Everett, 2013; Loke, M.H., 1999![]() ).
).
The pole-dipole array (Table 1) is designed with one current electrode (C1) placed at a distance na from a pair of potential electrodes (P1 and P2). P1 and P2 are separated by distance a. The second current electrode (C2) is placed at a distance from the survey line. This array is useful for horizontal profiling and has a higher signal strength than the dipole-dipole array. Errors introduced by neglecting the effects of the C2 electrode can be limited to less than 5% if the distance of C2 is at least five times the largest C1-P1 (na) distance used. This array is also asymmetrical which may cause symmetrical structures to yield asymmetrical apparent resistivities anomalies in the resistivity results. The anomalies can be addressed by repeating the measurement with the electrodes arranged in a reverse configuration. Because of this array's horizontal coverage, it is frequently used for multi-electrode resistivity meter systems (Loke, M.H., 1999![]() ).
).
Table 1. Common Surface Resistivity Arrays
| Array | Electrode Configuration | Mode | Strengths1 | Weaknesses |
| Schlumberger | 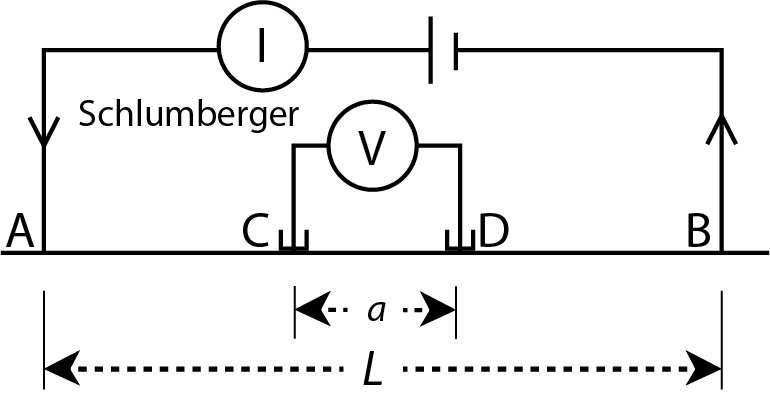
|
Sounding |
|
|
| Wenner |
|
Sounding and Profiling |
|
|
| Dipole-Dipole |
|
Sounding and Profiling |
|
|
| Pole-Dipole |

|
Sounding and Profiling |
|
|
1 The lists of strengths and weaknesses were adapted from the following references: Loke, M.H., 1999; Furman, A. et al., 2003; and Srinivasamoorthy K., et al., 2009.
Sources: Furman, A., et al., 2003; Lowrie, W., 2007![]() ; NRC, 1996; Zohdy, A, 1974.
; NRC, 1996; Zohdy, A, 1974.
Depending on the terrain, length of survey, crew size, and experience level, setup of a single line survey could take 2-4 hours; the reading itself could take another 2-4 hours. Dismantling the equipment typically takes 1-2 hours. The time to complete data inversion depends on other information pertinent to the model, including borehole data, geologic data, and noise sources. An inversion solely based on the resistivity readings can take 1 hour, while one based on borehole data, geologic data, and noise point sources may take several days (Everett, 2013).
To help determine whether the 2-D electrical resistivity imaging discussed in this section will be useful for subsurface characterization, USGS developed the Scenario Evaluator for Electrical Resistivity (SEER) Pre-Modeling Tool, an Excel-based decision support tool. Various electrode arrays can be selected for scenarios to see how expected subsurface features will appear in a resistivity cross section.
↩Data Display and Interpretation
While raw data from a resistivity survey can be interpreted in the field, most surveys undergo a data inversion process to remove signal noise from the survey and to correlate the resistivity readings to vertical and horizontal locations. The process also accounts for topography.
Algorithms are applied so that measurements from closely spaced electrodes are appropriately attributed to shallow layers. Then those same measurements are mathematically removed from the measurements of further spaced electrodes to represent deeper layers (Everett, 2013).
The resistivity of impermeable dry rock and dry soil is typically high, while that of saturated permeable material is low. However, the presence of clay (due to its colloidal content and surface charge) and/or metal ore bodies in unsaturated material will reduce the apparent resistivity (Benson, R., et al., 1984). More recent studies have shown that enhanced microbial activity will also locally reduce resistivity values (Atekwana, E. and E. Atekwana, 2010).
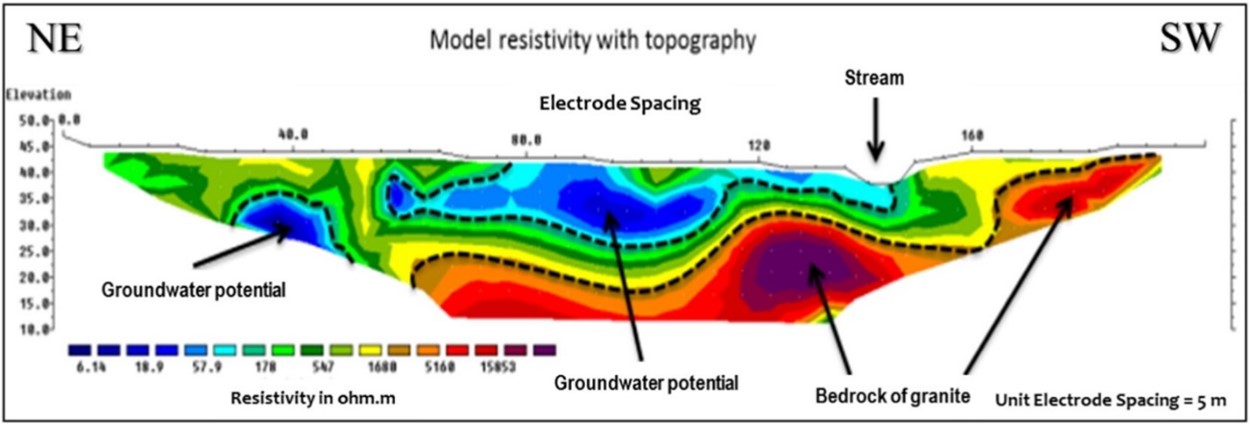
Figure 5. 2D resistivity cross section covering 200 meters of continuous ground (Nazaruddin, D.A., et al., 2017).
A typical resistivity cross section depicts a moderately resistive vadose zone ranging from green to orange, a less resistive saturated zone ranging blue to green, and a highly resistive confining layer ranging orange to maroon (Figure 5).
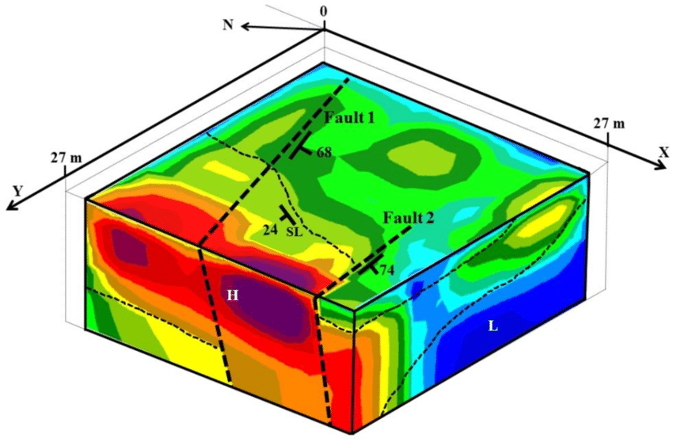
Figure 6. 3-D visualization of resistivity data from a 30m x 30m electrode grid array survey. This resistivity plot locates the faults, low resistivity zone (L) indicating a water-bearing zone, and high resistivity zone (H) indicating a low permeability zone (Petrit, K., et al., 2018![]() ).
).
One resistivity survey line can produce a 2-D cross section (Figure 5). Multiple lines can produce a 3-D model of the site subsurface as illustrated in Figure 6. If borehole data are available, the boring logs can be overlaid on cross sections. This technique is useful for both developing a quantitative interpretation of boring log data and comparing the resistivity model to ground truth observations.
Like any geophysical method, resistivity benefits from knowledge of the regional and local geology for its interpretation. Depending on the goal of the survey, additional geophysical methods may be instructive as well. For instance, if the goal is to characterize contamination from buried drums, the resistivity survey could delineate the trench and plume pathways, but metal detectors or magnetometers can better locate the metal drums (Marchetti, M. and A. Settimi, 2011; van Ee, 1985).
↩Performance Specifications
A typical line survey can interpret depths of up to 100m. Survey depth depends on the length of the survey line and the resistivity of the ground layers. Commonly used arrays (e.g., Schlumberger array and Wenner array) tend to have better vertical than horizontal resolution and are less susceptible to noise, while the dipole-dipole and pole-dipole arrays have better horizontal resolution but are more susceptible to noise. However, acquisition systems can be set up to collect hybrid arrays that improve resolution and reduce noise (Benson, R., et al., 1984; Furman, A., et al., 2003; Pierce, K., et al., 2012).
↩Advantages
- ERT provides broad brush, continuous, subsurface investigations across long distances (1-2 km) and covers wide areas with wide electrode spacing. It can provide short-distance, high-resolution, shallow investigation with narrow electrode spacing. There is resolution flexibility based on the setup.
- It can delineate distinct porosity and permeability zones in the subsurface to infer potential fluid pathways (Vogelgesang, J., et al., 2020).
- The penetration depth is convenient for many environmental remediation applications. ERT can measure greater depths than electromagnetics, another resistivity measurement technology (Everett, 2013).
- It can be used to monitor the distribution of microbial biomass, ionic amendments, or contaminants during treatment (Atekwana, E. and E. Atekwana, 2010; Nazaruddin, D.A., et al., 2017).
Limitations
- ERT is susceptible to various sources of noise (i.e., soil and rocks, groundwater chemistry, contamination, biological activity, metallic utility lines), which can "overprint" other signals and distort the interpretation of targeted features.
- It requires sufficient space to lay a profile array while avoiding power lines, fences, buried pipe, and paved surfaces (Benson, R., et al., 1984; Everett, 2013).
- It requires electrode installation (Benson, R., et al., 1984; Wightman, W.E., et al., 2003).
- Tall or thick vegetation may need to be cut or disturbed to sufficiently extend the cables and set up the equipment (Benson, R., et al., 1984).
- People and animals must be prevented from touching the electrodes and cables during a survey to avoid electrical shocks (Benson, R., et al., 1984).
Cost
For an 84-electrode line survey, the average equipment rental rate is $2,600/week for cables, electrodes, resistivity meters, and software.
↩Case Studies
![]() Electrical Resistivity Imaging (ERI) of a DNAPL Site: What Happens When Results Don't Equal Success?
Electrical Resistivity Imaging (ERI) of a DNAPL Site: What Happens When Results Don't Equal Success?
Fields, Jr. J. | Battelle 2024 Chlorinated Conference, 2-6 June, Denver, CO, poster, 2024
TCE, both dissolved phase and a DNAPL, prevalent in groundwater at a former Naval Ordnance Plant, led to vapor intrusion issues that have since been mitigated, leaving groundwater contamination. A partially delineated TCE plume in a sandy surficial aquifer absorbed into the underlying clay confining unit. Site characterization performed via monitoring wells and soil borings identified the main source area near a historic storm sewer outfall at the western edge of the site with DNAPL near the base of the previous depth of investigation. Groundwater concentrations indicative of NAPL were also identified in the central area of the site. However, the vertical and horizontal extent into and across the clay confining unit was unknown. The area of interest is an open field downgradient of the historic storm sewer outfall, located above the expected highest contaminant concentrations with a former explosives blending plant and storm drains to the north and east. The objective was to perform electrical resistivity imaging (ERI) surveys, providing thousands of data points in 2D space, and cross-reference the results with previous high-resolution lithological and chemical analysis of soil cores and groundwater samples, which provide data points, few and far between, in only 1D space. The ERI surveys were verified with confirmatory drilling, lithologic logging, sample collection, and analytical analysis. The goal of the effort was to expand the footprint of the previous investigations and demonstrate that a relatively inexpensive, fast, high-resolution, and non-invasive alternative geophysical field technique could delineate both the vertical and horizontal extent of the contaminant source area.
![]() Electrical Resistivity Tomography Monitoring of In Situ Soil Flushing at the Hanford 100-K East Area 100KE Soil Flushing Monitoring
Electrical Resistivity Tomography Monitoring of In Situ Soil Flushing at the Hanford 100-K East Area 100KE Soil Flushing Monitoring
Johnson, T., J. Thomle, J. Robinson, and R. Mackley. | Report PNNL-35781, 46 pp, 2024
In situ soil flushing was tested at the Hanford 100-KE Area to accelerate the removal of residual Cr(VI) in the vadose zone using 3D time-lapse electrical resistivity tomography (ERT) to monitor the distribution of flush water. The report includes results from 3D time-lapse ERT imaging during two separate soil flushing campaigns.
Understanding the Dynamics of Enhanced Light Non-Aqueous Phase Liquids (LNAPL) Remediation at a Polluted Site: Insights from Hydrogeophysical Findings and Chemical Evidence
Ciampi, P., G. Cassiani, G.P. Deidda, C. Esposito, P. Rizzetto, A. Pizzi, and M.P. Papini.
Science of The Total Environment 932:172934(2024).
An innovative technology combining ISCO and enhanced desorption was applied at a petroleum hydrocarbon-contaminated site to treat residual LNAPL and enhance the effectiveness of groundwater extraction and treatment systems. The system included injections of PetroCleanze® and RegenOx® into the subsurface to stimulate the desorption and oxidation of residual hydrocarbons, mobilizing them for subsequent extraction. Real-time subsurface dynamics were investigated through geophysical monitoring, employing electrical resistivity tomography (ERT) to trace reagent migration pathways via their effect on bulk electrical conductivity. Integrating groundwater sampling data aimed to provide additional insights into the transformations of contaminants in the spatiotemporal context. Vivid 2D time-lapse ERT sections showcased the evolution of resistivity anomalies, providing high-resolution evidence of heterogeneity, dispersion pathways of desorbent and oxidant, and residual LNAPL mobilization. Hydrochemical analyses revealed effective mobilization processes with increasing groundwater concentrations of TPH over time. Speciation analysis showed the interplay of desorption and oxidation, portraying the dynamic fractionation of hydrocarbon components. The hydrogeophysical and data-driven framework provided qualitative and quantitative insights into reagent and contaminant distribution, enhancing the understanding of spatial and temporal physio-chemical changes during the remediation process. Coupling hydrogeophysical and chemical findings provided insight into the transformation of contaminants following the sequence of product injection and the push and pull activities, capturing the removal of mobilized contaminants through hydraulic barrier wells. This enhanced understanding proves instrumental in optimizing and tailoring remediation efforts, especially in heterogeneous environmental settings.
Interpretation of Large-Scale, Long-Term Electrical Geophysical Monitoring Guided by a Process Simulation
Robinson, J., T. Johnson, J. Thomle, J. Cambeiro, K. Peta, P. Jaysaval, and R. Mackley.
Vadose Zone Journal 23(2):e20303(2024)
The BC Cribs and Trenches (BCCT) site at Hanford contains 20 disposal trenches and six disposal cribs. Wastes include a large inventory of Tc-99 and large masses of nitrate and U-238. Surface electrical resistivity tomography (ERT) was used at a waste site to monitor vadose zone changes in electrical properties as a proxy for contaminant flux over 17 years. ERT data were collected along 41 profiles in 2005 to characterize regions of elevated bulk electrical conductivity (BEC) associated with past liquid waste discharges. Previous analyses performed on samples from four boreholes showed a high correlation between nitrate concentration and BEC. In 2022, ERT data were re-collected along the same profiles and six additional profiles in an area not previously surveyed. Compared to background uncontaminated areas, BEC was higher in contaminated areas at the waste sites. Given the correlation between nitrate concentration and BEC previously found at this site, ERT images show the spatial distribution and relative ionic concentration of vadose zone contaminants at BCCT. Between 2005-2022, ERT difference images showed a decrease in BEC surrounding most waste sites, except where there were known anthropogenic surface changes. Evaluating recharge-driven nitrate migration using synthetic flow and transport simulations showed that downward migration causes a decrease in BEC from the decrease in ionic strength at the trailing end of the plume where contaminants migrated downward. ERT difference images were interpreted as showing the predominant regions of downward ion flux.
Environmental Impact Assessment of the Subsurface in a Former W-SN Mine: Integration of Geophysical Methodologies
De Almeida, H., M.C.G. Marques, H. Sant'Ovaia, R. Moura, and J. Espinha Marques, Minerals 13(1):55(2023)
This research proposes an innovative approach that integrates different geophysical techniques to characterize the impact of mining activity on the subsurface in an area surrounding the tungsten mine of Regoufe in northern Poland. Sulfide-rich tailing accumulation may have caused acid mine drainage (AMD), where leaching led to soil contamination, as evidenced by its acidic character and anomalous concentrations of Potentially Toxic Elements (PTE). Electrical resistivity and electromagnetic geophysical methods were used to measure subsurface electrical properties. In addition, seismic refraction and multichannel analysis of surface waves were performed to characterize the geometry, depth, and geomechanical behavior of the soil and rock bodies. Integrating these techniques allowed the interpretation of hydrogeological sections and a 3D resistivity volume to gain insight into the distribution of potentially contaminating fluids and tailings material present in the mining valley.
![]() Electrical Imaging for Hydrogeology
Electrical Imaging for Hydrogeology
Singha, K., Johnson, T., Day-Lewis, F., and Slater, L., 2022.
Geophysical methods offer hydrogeologists unprecedented access to understanding subsurface parameters and processes. In this book, we outline the theory and application of electrical imaging methods, which inject current into the ground and measure the resultant potentials. These data are sensitive to rock type, grain size, porosity, pore fluid electrical conductivity, saturation, and temperature. Here, we describe the physical basis for electrical imaging, parallels between electrical flow equations and the groundwater flow equation, practical considerations for field investigations, data processing and inverse modeling of field data, and how to QA/QC data. We additionally cover two case studies, including a 2-D waterborne survey and a 4-D dataset from a biostimulation experiment.
One-off Geophysical Detection of Chlorinated DNAPL During Remediation of an Industrial Site: A Case Study
Fiorentino, E., et al., 2021.
AIMS Geosciences, Volume 7. Issue 1, January.
This paper describes a geophysical survey performed on an industrial site impacted by a chlorinated DNAPL. The precise location of the contamination was needed to treat the saturated zone, while the unsaturated zone was remediated by excavating the sediments followed by separate treatment. As this excavation allowed closer proximity to the saturated zone, geophysical measurements were conducted at the bottom of the pit. Whereas electrical resistivity tomography measurements provided minimal information, ground penetrating radar drew the remediation operations toward an area that preliminary point measurements had not identified as a possible source.
Geophysical Characterization of Hydraulic Properties Around a Managed Aquifer Recharge System Over the Llobregat River Alluvial Aquifer (Barcelona Metropolitan Area)
Sendrós, A., et al., 2020.
Water, Volume 12, Issue 12, December.
The aim of the research was to develop a non-invasive methodology to improve the planning and design of surface-type artificial recharge infrastructures for increasing storage of runoff and regenerate water. An approach was proposed combining direct and indirect exploration techniques such as electrical resistivity tomography (ERT), frequency domain electromagnetics and data from double-ring infiltration tests, trial pits, research boreholes, and piezometers. The ERT method provided more complete and representative information in a zone where the recharge project works below design infiltration rates. The geometry of the hydrogeological units and the aquifer-aquiclude contact are accurately defined through models derived from the interpretation of ERT cross sections in the alluvial aquifer setting.
![]() Application of Electrical Resistivity Data Sets for the Evaluation of the Pollution Concentration Level within Landfill Subsoil
Application of Electrical Resistivity Data Sets for the Evaluation of the Pollution Concentration Level within Landfill Subsoil
Koda, E., et al., 2017.
Applied Sciences, Volume 7, Issue 3.
Electrical resistivity was used to investigate potential pollutant migration pathways within areas of existing and former landfill sites: four municipal waste landfills and one industrial landfill were chosen for further comprehensive analyses. The landfill bottom had a geomembrane liner, but groundwater monitoring results revealed that the base was not leakage-free. Another two landfills were established prior to the legal requirement for containment systems. The geoelectrical investigation was the final part of an overall analytical assessment of the contaminated sites. The study was aimed at pollution spatial migration analyses and the interpretation of results, for further design of the reclamation and restoration plans. A clear correlation between pollution indicators such as salt compounds and electrical resistivity allows aerial analyses and the precise determination of contaminated zones.
Imaging Pathways in Fractured Rock Using Three-Dimensional Electrical Resistivity Tomography
Groundwater, Volume 54, No. 2, pp. 186-201.
Robinson, J., et al., 2016.
Researchers used 3-D cross-borehole ERT in a 9 m x 15 m well field to capture high-resolution flow and transport processes in a fractured mudstone contaminated by chlorinated solvents, primarily TCE. Electrode arrays with isolation packers and fluid sampling ports were designed to acquire ERT measurements during pulsed conductive (sodium bromide) and resistive (deionized water) tracer injections. Fracture zone locations and hydraulic pathways inferred from hydraulic head drawdown data were compared with electrical conductivity distributions from ERT measurements. Static ERT imaging has limited resolution to decipher individual fractures; however, these images showed alternating conductive and resistive zones consistent with alternating laminated and massive mudstone units at the site. Tracer evolution and migration were clearly revealed in time-lapse ERT images and supported by in situ borehole vertical apparent conductivity profiles collected during the pulsed tracer test. While water samples provided important local information at the extraction borehole, ERT delineated tracer migration over spatial scales, capturing the primary hydrogeological heterogeneity controlling flow and transport. The fate of the tracer injections at this scale could not have been quantified using borehole logging and/or borehole sampling methods alone.
![]() Optimized Enhanced Bioremediation Through 4D Geophysical Monitoring and Autonomous Data Collection, Processing and Analysis
Optimized Enhanced Bioremediation Through 4D Geophysical Monitoring and Autonomous Data Collection, Processing and Analysis
Major, W. and R. Versteeg, 2014.
ESTCP Project ER-200717, pp. 99.
The performance objectives of this technology demonstration were to show that automated electrical geophysical monitoring can be used as an alternative to existing methods to provide timely, volumetric, and cost-effective information on spatiotemporal behavior of amendments used in enhanced bioremediation. These objectives included quantitative and qualitative measures. Quantitative measures were formulated in terms of spatial resolution, temporal resolution, and data processing time/turnaround. Qualitative measures pertained to timely delivery of actionable information to scientists/engineers in the field and the ability of geophysical monitoring to map amendment behavior.
Electrical Resistivity Imaging of a Permanganate Injection During In Situ Treatment Of RDX-Contaminated Groundwater
Halihan, T., J. Albano, S.D. Comfort, and V.A. Zlotnik, 2012.
Ground Water Monitoring & Remediation, Volume 32, No. 1, pp. 43-52.
Electrical resistivity imaging (ERI) was used to create 2-D images of the demonstration site prior to, during, and after sodium permanganate injection to treat RDX-contaminated groundwater. Extraction and injection wells were configured to create a permanganate curtain in the subsurface. Downgradient monitoring wells captured the permanganate-RDX plume. Differences between ERI taken pre- and post-injection showed the initial distribution of the injected permanganate. ERI also quantitatively corroborated the hydraulic conductivity distribution across the site. Although groundwater samples from 12 downgradient wells and eight direct-push profiles did not provide enough data to quantify the distribution and flow of the injected permanganate, ERI showed that the permanganate injection flowed against the regional groundwater gradient and migrated below monitoring well screens. ERI combined with monitoring well samples helped explain the permanganate dynamics in downgradient wells, and the results support the use of ERI as a means of monitoring in situ chemical oxidation injections.
ERI Evaluation of Injectates Used at a Dry-Cleaning Site
Halihan, T., S.W. McDonald, and P. Patey, 2012.
Remediation, Volume 22, Issue 3, pp. 79-91, Summer.
Subsurface TCE and PCE contamination was treated at a dry-cleaner facility that closed in 1977. In 2002, a series of injections included corn syrup, vegetable oils, and Simple Green(r). In 2004, ~200 cubic yards of contaminated soil were excavated, and the bottom of the excavation covered with sodium lactate. In 2009, the site was characterized using electrical resistivity imaging and follow-up confirmation soil borings that targeted the detected anomalies. The results indicate an extremely conductive (<1 ohm-m) vadose zone downgradient from the injection wells and extremely resistive areas (>10,000 ohm-m) near the injection area. Sample data indicate that the electrically resistive zones contain moderate to high concentrations of undegraded dry-cleaning compounds. Electrically conductive zones are interpreted to be areas of biological activity generated by the injected amendments to the site based on the extreme conductivity values detected, the chemical composition, and the dominant vadose zone location of the conductive zones.
![]() Using Electrical Resistivity Imaging to Evaluate Permanganate Performance During an In Situ Treatment of a RDX-Contaminated Aquifer
Using Electrical Resistivity Imaging to Evaluate Permanganate Performance During an In Situ Treatment of a RDX-Contaminated Aquifer
Comfort, S., V. Zlotnik, and T. Halihan, 2009.
ESTCP Project ER-0635. August.
In this demonstration, electrical resistivity imaging (ERI) was used to monitor injection of sodium permanganate to mineralize RDX at the Nebraska Ordnance Plant. Monitoring well data provided insufficient data to construct the distribution and flow of the injected permanganate. ERI showed that the permanganate injection flowed against the regional groundwater gradient, and the solution was able to sink below the monitoring well screens. Results suggest ERI should be further explored and developed for use in pre-amendment tracer tests and quantitative remedial assessments.
Electrical Imaging of Tracer Migration at the Massachusetts Military Reservation, Cape Cod
Singha, K., et al., 2003.
Conference Proceedings, 16th EEGS Symposium on the Application of Geophysics to Engineering and Environmental Problems, cp-190-00045, April.
The potential of ERT to provide spatially continuous information about aquifer properties through imaging of tracer flow and transport in an unconfined aquifer was examined during the summer of 2002. High-resolution images in both space and time of the movement of an electrically conductive sodium chloride tracer in 3-D helped delineate aquifer heterogeneity. Sixty 3-D data sets were collected between four corner-point wells for 20 days following the 9-hour injection. Concentrations were measured at a 15-point multilevel sampler in the center of the ERT array, at the production well, and at two wells external to the central array. The results indicate that resistivity tomograms are an appropriate surrogate for concentration maps that are otherwise impossible to obtain. Under reasonable assumptions, estimates of groundwater velocity and hydraulic conductivity can be obtained by tracking the tracer.
↩References:
Atekwana, E. and E. Atekwana, 2010. Geophysical Signatures of Microbial Activity at Hydrocarbon Contaminated Sites: A Review. Surveys in Geophysics, Volume 31, Issue 2, pp. 247-283, March.
Ball, L. and A. Teeple, 2013. Characterization of Major Lithologic Units Underlying the Lower American River Using Water-Borne Continuous Resistivity Profiling, Sacramento, California, June 2008. U.S. Geological Survey (USGS) Open-File Report 2013-1050, pp. 17.
Belaval, M.,J.W. Lane, Jr., D.P. Lesmes, and G.C. Kineke, 2003. Continuous-Resistivity Profiling for Coastal Ground-Water Investigations: Three Case Studies. Symposium on the Application of Geophysics to Engineering and Environmental Problems.
Benson, R.,R.A. Glaccum, and M.R. Noel, 1984. Geophysical Techniques for Sensing Buried Waste and Waste Migration. Prepared for U.S. Environmental Protection Agency. EPA-600/7-84-064, pp. 256, June.
Everett, M.E., 2013, Near-surface applied geophysics. Cambridge University Press.
Furman, A., T. Ferré, and A. W. Warrick, 2003, A Sensitivity Analysis of Electrical Resistivity Tomography Array Types Using Analytical Element Modeling. Vadose Zone Journal. Vol. 2, Issue 3, pp. 416-423.
Herman, R., 2001. ![]() An introduction to electrical resistivity in geophysics. American Journal of Physics 69, No. 9, pp. 943-952.
An introduction to electrical resistivity in geophysics. American Journal of Physics 69, No. 9, pp. 943-952.
Interstate Technology & Regulatory Council (ITRC). 2019. Implementing Advanced Site Characterization Tools. ASCT-1. Washington, D.C.: Interstate Technology & Regulatory Council, Advanced Site Characterization Tools Team. December.
Lapenna, V. and A. Perrone, 2022. Time-Lapse Electrical Resistivity Tomography (TL-ERT) for Landslide Monitoring: Recent Advances and Future Directions. Applied Sciences. 12. 1425. 10.3390/app12031425.
Loke, M.H., 1999. Electrical Imaging Surveys for Environmental and Engineering Studies. A Practical Guide to, 2, p.70.
Lowrie, W., 2007. ![]() Fundamentals of Geophysics, 2nd Edition. Swiss Federal Institute of Technology, Zurich.
Fundamentals of Geophysics, 2nd Edition. Swiss Federal Institute of Technology, Zurich.
Marchetti, M. and A. Settimi, 2011. Integrated Geophysical Measurements on a Test Site for Detection of Buried Steel Drums. Annals of Geophysics, Vol. 54, pp. 105-114.
National Research Council (NRC), 1996. Rock Fractures and Fluid Flow: Contemporary Understanding and Applications. Washington D.C.: The National Academies Press.
Nazaruddin, D.A., Z.S. Amiruzan, H. Hussin, M. Taufiq, and M. Jafar, 2017. Integrated Geological and Multi-Electrode Resistivity Surveys for Groundwater Investigation in Kampung Rahmat Village and Its Vicinity, Jeli District, Kelantan, Malaysia. Journal of Applied Geophysics, Volume 138, pp. 23-32, March.
Pierce, K., et al., 2012. Santee Basin Aquifer Recharge Study, Santee, California. TM-86-68330-2012-23, pp. 109, December.
Petrit, K., P. Klamthim, and H. Duerrast, 2018. 3D Resistivity Survey for Shallow Subsurface Fault Investigations. In E3S Web of Conferences, Volume 34, pp. 01007. EDP Sciences.
Sattar, G., S. Shahid, and M. Keramat, 2016. Deciphering Transmissivity and Hydraulic Conductivity of the Aquifer by Vertical Sounding (VES) in Northwest Bangladesh. Applied Water Science, Volume 6, Issue 1, pp. 35-45, March.
Singha, K. and S. Gorelick, 2005. Saline Tracer Visualized with Three-dimensional Electrical Resistivity Tomography: Field-scale Spatial Moment Analysis. Water Resources Research, Volume 41, Issue 5, pp. 17, May.
Srinivasamoorthy, K., S. Chidambaram, and M. Vasanthaviger, 2009. Identification of groundwater recharge zones in a hard rock terrain using electrical resistivity methods. Journal of Applied Hydrology, Volume 22, pp. 68-79.
USGS, 2016. USGS Fractured Rock Geophysical Toolbox Method Selection Tool. December.
USGS, 2017. Scenario Evaluator for Electrical Resistivity (SEER) Survey Pre-Modeling Tool.
USGS, 2018. Borehole Geophysics. New York Water Science Center. December.
Van Ee, J., 1985. Geophysical Techniques for Sensing Buried Wastes and Waste Migration. EPA/600/S7-84/064, pp. 8, May.
Vilar, A.S., A. Ustra, and C.A. Mendonca., 2015. ![]() Surface and Downhole Electrodes in Electrical Resistivity Tomography. 14th International Congress of the Brazilian Geophysical Society, Rio de Janeiro, Brazil, August 3-6.
Surface and Downhole Electrodes in Electrical Resistivity Tomography. 14th International Congress of the Brazilian Geophysical Society, Rio de Janeiro, Brazil, August 3-6.
Vogelgesang, J., N. Holt, K.E. Schilling, M. Gannon, and S. Tassier-Surine. 2020. Using high-resolution electrical resistivity to estimate hydraulic conductivity and improve characterization of alluvial aquifers. Journal of Hydrology, Volume 580, Article 123992, January.
Wightman, W. E., Jalinoos, F., Sirles, P., and Hanna, K., 2003. Application of Geophysical Methods to Highway Related Problems. Federal Highway Administration, Central Federal Lands Highway Division, Lakewood, CO, Publication No. FHWA-IF-04-021, September.

