
 |
Cost and Performance
Report:
|
Preparation of this report has been funded wholly or in part by the U.S. Environmental Protection Agency under Contract Number 68-W3-0001. It has been subject to administrative review by EPA headquarters and Regional staff and by the technology vendor. Mention of trade names for commercial products does not constitute endorsement or recommendation for use.
This report presents cost and performance data for a soil vapor extraction (SVE) system at the Burn Pits Operable Unit, Sacramento Army Depot (SAAD) Superfund site in Sacramento California. The SVE system was used at the Burn Pits Operable Unit to treat soil contaminated with halogenated volatile organic compounds (VOCs), specifically trichloroethene (TCE), tetrachloroethene (PCE), and 1,2-dichloroethene (DCE).
The Burn Pits Operable Unit at SAAD was the location of two rectangular trenches constructed in the late 1950s and used intermittently as incineration pits until 1966. Materials reportedly buried and/or burned in the pits included plating shop wastes, oil and grease, batteries, and construction debris. Remedial investigations conducted from 1990 to 1993 showed average soil contaminant concentrations for TCE ranging from 0.0029 to 0.0069 mg/kg, PCE from 0.0029 to 0.0079 mg/kg, and DCE from 0.0038 to 0.0055 mg/kg. In addition, the Army’s basewide contractor estimated the total mass of selected contaminants in the operable unit as follows: TCE - 22.3 pounds (lbs); PCE - 7.1 lbs; and DCE - 39.3 lbs.
A Record of Decision (ROD) addressing the Burn Pits Operable Unit was signed in March 1993 and specified soil cleanup standards of 0.005 mg/kg for each of the three VOCs identified above. Although not shown in the ROD, the treatment vendor reported the following air emission rate limits for this application: TCE - 0.0043 lbs/hr; PCE - 0.003 lbs/hr; and 1,2-DCE - 0.003 lbs/hr.
The SVE system used was a patented fluid injection/vapor extraction (FIVE) system. In the FIVE technology, pressurized air is injected into vadose zone soils to produce relatively larger subsurface pressure gradients and higher flow rates of extracted vapors than would be achieved solely with using vapor extraction technology. The vendor stated that this system “enhanced subsurface volatilization and shortened the period of remediation,” however, no data were provided to support this statement. The FIVE system used at the SAAD Burn Pits consisted of 10 shallow extraction/injection wells, 12 deep extraction/injection wells, 1 horizontal extraction/injection well, air injection piping, vapor monitoring wells, liquid/vapor separators, high efficiency particulate filters, vapor phase granular activated carbon, and positive displacement blowers. The wells were screened up to 80 feet below ground surface.
The FIVE system was operated from May 1994 to January 1995, and again from March 1995 to September 1995, for a total of 347 days of run time. Confirmatory soil borings collected in September 1995 showed that the average concentrations for each of the three target contaminants was less than the cleanup standards set in the ROD. TCE was reduced to an average concentration of 0.0021 mg/kg, PCE to 0.0013 mg/kg, and DCE to 0.0027 mg/kg. Analytical data collected in this application showed that the rate of VOC removal decreased over the course of the remediation. For example, the VOC extraction rate decreased from an average of 4 lbs/day over the first 20 days of system run time to less than 1 lb/day after 40 days of system run time. Approximately 138 lbs of VOCs were extracted during this application, or roughly two times as much VOCs as originally estimated to be present at the operable unit. The vendor indicated that a possible reason for this result is an inaccuracy in the original estimate for the operable unit.
The total actual costs for this application were approximately $865,873. Of this total, approximately $195,000 were expended in before-treatment costs for drilling, soil gas survey, confirmatory boring, and chemical testing, and approximately $670,500 were expended for activities directly attributed to treatment, such as design, mobilization, construction, start-up/testing/permitting, SVE operations and maintenance, and demobilization. The $670,500 in costs directly attributed to treatment corresponds to $2.70 per cubic yard of soil treated (247,900 cubic yards) and $4,858 per pound of target VOC extracted (138 pounds of TCE, PCE, and DCE). These unit costs show that this application treated a relatively large volume of soil contaminated with relatively small concentrations of target VOCs.
Table of Contents |
Forward to Site Information
Sacramento Army Depot
Sacramento, California
Operable Unit: Burn Pits
CERCLIS # CA0210020780
ROD Date: February 26, 1993
Type of Action: Remedial
Treatability Study Associated with Application? No
EPA SITE Program Test Associated with Application? No
Operating Period: May 1994 - September 1995
Quantity of Material Treated During Application: 247,900 cubic yards of
soil. The burn pits contain approximately 16,900 cubic yards of contaminated
soil, and the surrounding area contains approximately 231,000 cubic yards of
contaminated soil. [3] This quantity is based on an area of
78,750 square feet and a depth of 85 feet. [12]
Historical Activity That Contributed to Contamination at the Site:
Metal-plating and painting operations
Corresponding SIC Code:
3471: Electroplating, Plating, Polishing, Anodizing, and Coloring
3479: Coating, Engraving, and Allied Services, Not Elsewhere Classified
Waste Management Practices That Contributed to Contamination: Disposal
Pit; Incineration Residuals Handling
Site History: The Sacramento Army Depot (SAAD) is a 485-acre U.S. Army support facility, located in Sacramento, California, as shown on Figure 1. Current and historical operations conducted at the facility include electro-optics equipment repair, emergency manufacturing of parts, shelter repair, metal plating and treatment, and painting. In conjunction with these operations, the Army maintained unlined oxidation lagoons and burn pits, a battery disposal area, areas designated for mixing pesticides, and a firefighter training area.
In 1978 and 1979, the U.S. Army Toxic and Hazardous Materials Agency (USATHMA) identified several areas at SAAD, based on historical data, where the use, storage, treatment, and disposal of toxic substances may have contributed to contamination of soil and/or groundwater. In 1981, the Army and the California Central Valley Regional Water Quality Control Board (CVRWQCB) conducted investigations of soil and groundwater in the areas identified by USATHMA. The groundwater under the southwest corner of SAAD was determined to be contaminated with volatile organic compounds (VOCs) with the burn pits suspected as the main source of groundwater contamination.
Two burn pits were constructed at SAAD in the late 1950s, and served intermittently as incineration pits until 1966. The two burn pits are rectangular trenches, referred to as the "North Burn Pits" and "South Burn Pits." Each burn pit is about 30 feet wide, 330 to 345 feet long, and approximately 16 to 19 feet deep. Materials that were reportedly buried and/or burned in the burn pits include plating shop wastes, oil and grease, batteries, and uncontaminated construction debris. As of 1993, the burn pits were filled to the ground surface with soil and debris, including scrap metal, concrete, wood, and glass.
The Burn Pits Operable Unit occupies approximately 2 acres in the southwest portion of SAAD, and consists of the North and South Burn Pits and surrounding area. The operable unit is approximately 85 feet deep, extending through the vadose zone to the water table. A site map of the SAAD facility showing the location of the burn pits operable unit is shown on Figure 2.
The 1981 investigations also identified six other potential areas of contamination: the Tank 2 area, the oxidation lagoons, the Building 320 leach field, the pesticide mix area, the firefighter training area, and the battery disposal well. Operable units were defined for each of these areas of contamination. A remedial investigation identified several volatile and non-volatile organic and metal constituents in the soil at SAAD. As a result of these investigations, SAAD was placed on the National Priorities List (NPL), effective August 21, 1987.
Regulatory Context: In December 1988, the Army, EPA, and the State of
California signed a Federal Facility Agreement (FFA) under CERCLA Section 120,
to address the entire facility, including the contaminated groundwater and the
following seven areas of suspected contamination on the SAAD facility:
The FFA also required a RCRA Facility Assessment to identify other solid waste management units that needed further characterization and cleanup. Under the FFA, the U.S. Army was the lead agency responsible for implementing the environmental response activities at SAAD.
A Record of Decision (ROD) for the Burn Pits Operable Unit was signed by the
Army, California EPA, and the U.S. EPA in March 1993. The ROD required:
The ROD identified soil cleanup standards of 0.005 mg/kg for three VOCs: trichloroethene (TCE), tetrachloroethene (PCE), and 1,2-dichloroethene (1,2-DCE).
For non-volatile contaminants, the ROD required soils to be solidified so that the waste extract did not exceed the following levels: arsenic, 5 mg/L; cadmium, 1 mg/L; chromium, 5 mg/L; and lead, 5 mg/L.
Remedy Selection: Six alternatives were considered for remediation of the burn pits operable unit. The remedy described above was selected based on a comparative analysis of the six alternatives, in terms of short- and long-term effectiveness, permanence, reduction of toxicity, mobility, and volume, implementability, and cost.
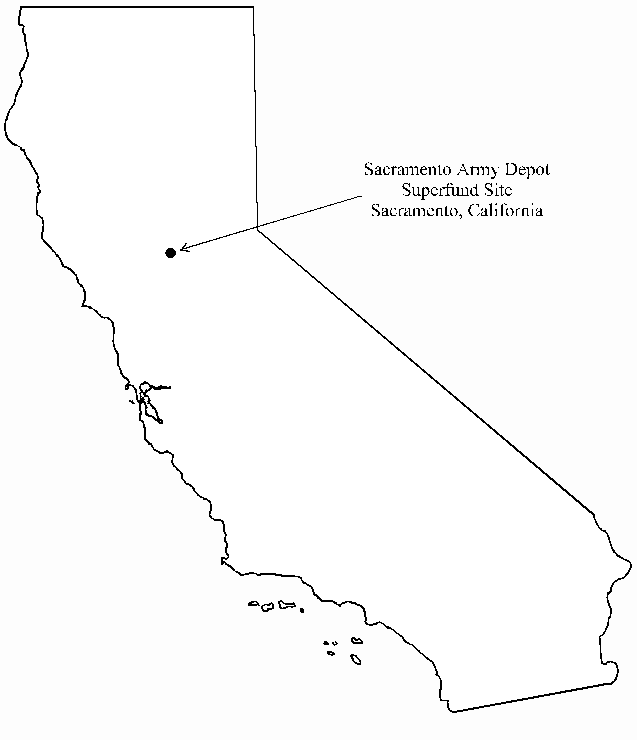
Figure 1. Site Location
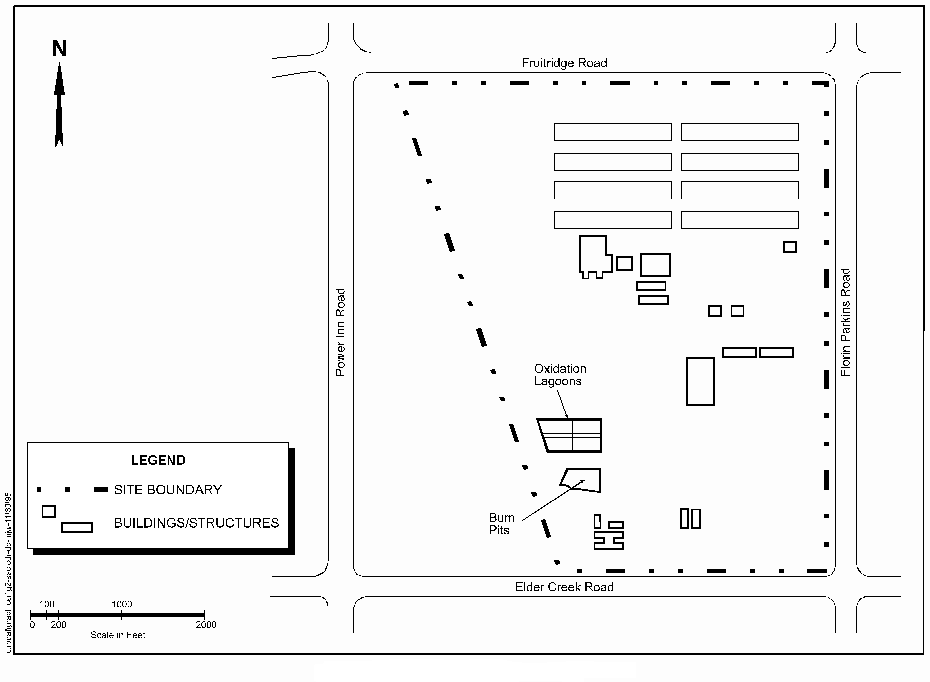
Figure 2. Location of Burn Pits at SAAD [1]
Site Management: U.S. Army-lead
Oversight: EPA
Remedial Project Manager: Marlin Mezquita
U.S. EPA Region 9
75 Hawthorne Street
San Francisco, CA 94105
(415) 744-2393
U.S. Army Project Manager: Dan Oburn (primary contact for this
application)
U.S. ACE, Sacramento District
1325 J Street
Sacramento, CA 95814-2922
(916) 557-7936
Treatment System Vendor: Ashok Gopinath
OHM Remediation Services Corp.
5731 W. Las Positas Blvd.
Pleasanton, CA 94588
(510) 227-1100
Basewide Contractor: Pamela Wee
Kleinfelder Inc.
3077 Fite Circle
Sacramento, CA 95827
(916) 366-1701
Back to Executive Summary |
Table of Contents | Forward to Matrix Description
Type of Matrix Processed Through the Treatment System: Soil (in situ)
Primary Contaminant Group: Organic Compounds; Volatiles-Halogenated
The Army divided the Burn Pits Operable Unit into five “units” to evaluate health risks and develop remediation plans. The average concentrations of selected organics and metals in the five units were quantified during a 1990-1993 remedial investigation (RI), as shown in Table 1.
In addition, as part of the remediation planning process, the mass of the
three VOCs present in the operable unit was estimated as follows (5):
Table 1. Summary of Average Soil Concentrations of Organics and Metals Measured During 1990-1993 Remedial Investigation [1]
| Organics |
Average Concentrations* (mg/kg) |
Metals |
Average Concentrations* (mg/kg) |
|---|---|---|---|
| Trichloroethene | 0.0029 - 0.0069 |
Antimony | 6.0 |
| Tetrachloroethene | 0.0029 - 0.0079 |
Arsenic | 6.0 |
| 1,2-Dichloroethene | 0.0038 - 0.0055 |
Boron | 6.5 |
| Ethylbenzene | 0.003 - 0.0061 |
Cadmium | 4.9 |
| Toluene | 0.0029 - 0.0092 |
Chromium (total) | 51.9 |
| Xylene | 0.0029 - 0.0072 |
Copper | 68.4 |
| Di-n-butyl phthalate | 0.1721 - 0.2147 |
Lead | 64.5 |
| Arochlor 1254 | 0.14 |
Manganese | 380 |
| Arochlor 1260 | 0.06 |
Mercury | 0.1 |
| 2,3,7,8-TCDD equivalent | 0.000098 |
Molybdenum | 1.1 |
| Silver | 0.23 |
||
| Zinc | 158.6 |
*Average concentrations for volatile organics are shown in Table 1 as a range of concentrations quantified in the five units of the Burn Pits Operable Unit. For arochlors 1254 and 1260, 2,3,7,8-TCDD, and all metals shown, an average concentration was identified only for one of the five units. For these constituents, only a single value is shown in Table 1.
At an unspecified date prior to remediation, OHM collected "baseline" soil samples. These samples were collected from a depth of 80 feet bgs. Soil samples were collected in brass sleeves placed inside a split-spoon sampler and sent to an off-site laboratory certified by the state of California. The soil samples were analyzed by USEPA Method 8240 for volatile organic compounds. In the baseline soil samples, the concentrations of TCE, PCE, and 1,2-DCE were all below the analytical detection limits (0.001 mg/kg for these samples), with one exception. In well SVW13, TCE was detected at a concentration of 0.012 mg/kg. The baseline samples contained lower concentrations of VOCs in soil than measured during the RI (see Table 1).
The major matrix characteristics affecting cost or performance for this technology and the values measured for each are shown in Table 2.
Table 2. Matrix Characteristics [3, 12]
| |
|
Measurement Method |
|---|---|---|
| Soil Classification | See discussion under site geology | - |
| Clay Content and/or Particle Size Distribution | See discussion under site geology | - |
| Moisture Content | Not measured but vendor estimated moisture content would be between 5-15% | N/A |
| Air Permeability | Not measured | N/A |
| Porosity | Not measured | N/A |
| Total Organic Carbon | Not measured | N/A |
| Nonaqueous Phase Liquids | Not present | Not reported |
N/A - Not applicable because value not measured.
Back to Site Information | Table of Contents | Forward to Treatment System Description
Site Geology/Stratigraphy
SAAD is located in the Great Valley of California, a broad asymmetric trough filled with a thick assemblage of flat-lying marine and non-marine sediments. The most recent formations deposited in the Great Valley are non-marine sediments derived from the Sierra Nevada foothills and mountains on the west side of the valley and from the Coast Ranges on the east side of the valley. [1]
The upper 250 feet of sediments under SAAD consist of interbedded sands, silts, and clays, with some coarse gravels underlying the north side of the facility at an approximate depth of 40 feet. Older buried stream channels exist at various locations and depths in the area. These streams have deposited materials ranging in size from gravel to clay. Multiple discontinuous hardpans (cemented clays), representing ancient soil horizons, exist throughout the site. [1]
As part of this remediation, the treatment vendor performed extensive investigations into site geology, including a "facies analysis" to collect data concerning the sedimentary structures and scales of heterogeneity in strata within the vadose zone. The results of the facies analysis were used in the design of the SVE system, particularly in the locations and depths of the extraction wells. Facies were defined by grain size classified according to the Unified Soil Classification System (USCS), color classified according to the Munsell chart, moisture, physical properties, sorting, roundness, composition, contacts, and sedimentary structures. The facies analysis also incorporated standard practices for description and identification of soils as described in ASTM Method D2488-90. [3]
Six facies were identified during this investigation. The most common facies were artificial fill (AF), sandy silt (ML), silty sand (SM), and sand (SP). The least common facies were clay (CL) and clayey sand (SC). Table 3 shows the range of percentages of facies measured in extraction well borings. [3] According to the vendor, the subsurface at the Burn Pits consisted mainly of debris till 20 feet and then silty sand to sandy silt to sand. [12]
Table 3. Range of Percentages of Facies in Extraction Well Borings [3]
| Facie |
Range of
Percentages of Facies |
|---|---|
| Sandy Silt (ML) | 3 - 66 |
| Silty Sand (SM) - weak to moderate cementation - moderate to strong cementation |
|
| Sand (SP) | 2 - 55 |
| Clay (CL) | 2 - 18 |
The California Department of Water Resources has divided the water-bearing sediments in the soil at SAAD into two hydraulically isolated sections: the superjacent (upper) series, at depths of about 80 to 250 feet beneath the site; and, the subjacent (lower) series, at depths below about 250 feet. [1]
Soil Vapor Extraction
Post-Treatment (Air) - Carbon Adsorption
The SVE system used at the Burn Pits Operable Unit was OHM's patented fluid injection-vacuum extraction (FIVE) technology. The FIVE technology consists of injection of pressurized air into vadose zone soils, and extraction of vapors from vadose zone soils. This approach is intended to produce relatively larger subsurface pressure gradients, and higher flow rates of extracted vapors, than would be achieved solely with using vapor extraction technology. [6]
The SVE system used at the Burn Pits Operable Unit consisted of 10 shallow extraction/injection wells, 12 deep (nested) extraction/injection wells, 1 horizontal extraction/injection well, air injection piping, 6 "SEAMIST" monitoring wells (in-ground vapor measurement wells), liquid/vapor separators, high efficiency particulate (HEPA) filters, vapor phase granular activated carbon, and positive displacement blowers. Figure 3 shows the locations of the extraction/injection and monitoring wells relative to the North and South Burn Pits, and Figure 4 shows the SVE system.
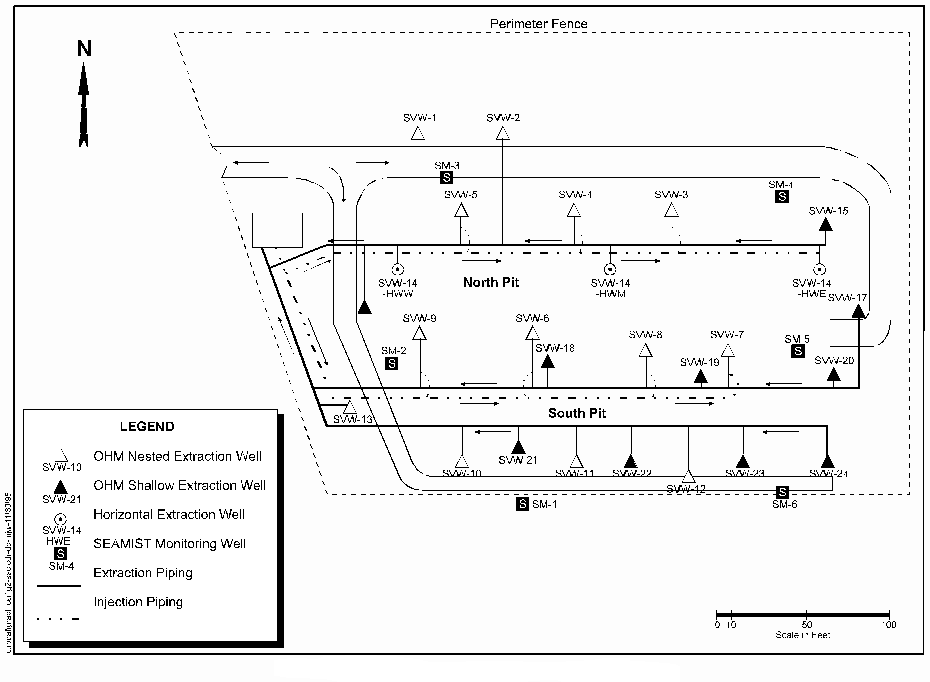
Figure 3. Well Locations at Burn Pits Operable Unit [4]
The shallow wells contained a 15-foot well screen extending from 10 to 25 feet below ground surface (bgs). The screen interval was located in sediments adjacent to and below the bottom of the artificial fill placed in the burn pits. In addition, a distinct well-cemented paleosol was present at the site at a depth of approximately 20 to 25 feet bgs. The shallow wells were located at this depth because the well-cemented paleosol had lower permeability than surrounding sediments, and the downward migration of volatile and semivolatile organic compounds would be temporarily restricted at this point.
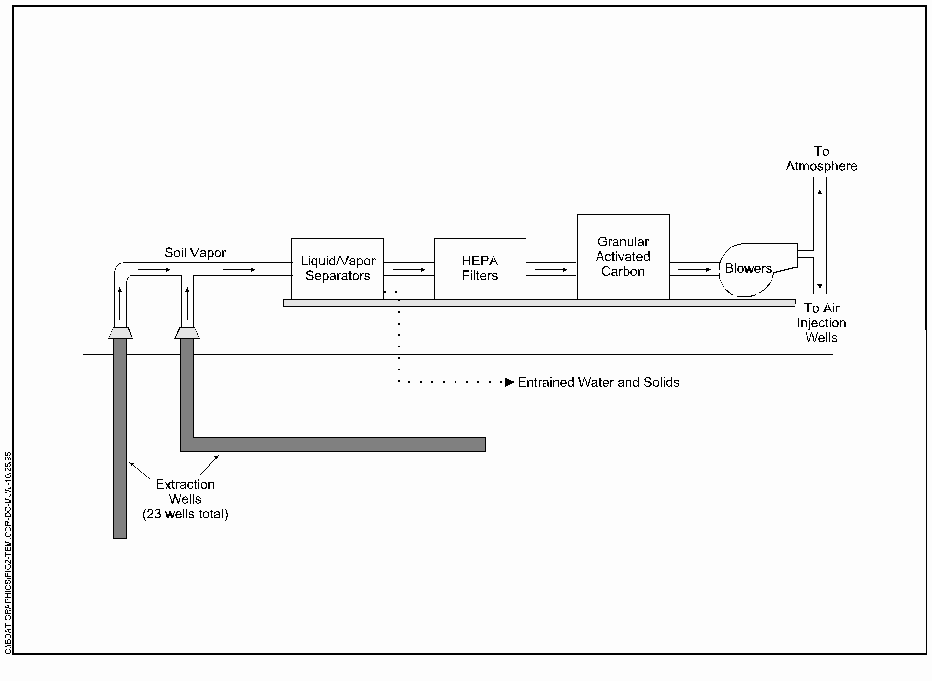
Figure 4. SVE System Schematic [Based on 2,6]
The deeper (nested) wells contained two screened areas in a single borehole, including 50 to 80 feet bgs, and 17 to 47 feet bgs. Two screen intervals were incorporated into the deeper well design to enhance air flow and vapor extraction throughout the 80-foot vadose zone. The two screened areas in the deeper wells were separated by a 2-foot (minimum thickness) bentonite seal. A 325-foot horizontal well was included in the SVE system design because it had been installed by a previous contractor (prior to OHM). It was not reported if this well was located in the shallow or deep zones.
As shown in Figure 4, soil vapors extracted through the vertical and horizontal wells were first treated using liquid/vapor separators. Entrained water (predominantly perched groundwater) and solids were removed from the vapor stream in the separators. Water and solids removed from the vapor stream were shipped off site to licensed disposal facilities in California. From the separators, the vapor stream passed through the HEPA filters which were designed to remove particulates larger than 0.3 microns.
The filtered vapor stream was then treated to remove VOCs using two parallel
trains of vapor phase granular activated carbon adsorption units (each
containing primary and secondary units). The granular activated carbon units
contained a total of 8,400 pounds of carbon, and were designed to have an
overall VOC removal efficiency of 99 percent. The design basis for the system
assumed the following mass extraction rates:
Treated vapor was injected into the vadose zone or released to the atmosphere using two rotary, positive displacement blowers, each having a capacity of 1,000 scfm.
Injection Wells
The instrumentation and piping for each vertical and horizontal well was designed to be operated in either extraction or injection mode. Valves were installed at the well head to isolate the piping that was not in use. These valves were adjusted manually during system operation. In addition, valves of the manifold system were adjusted to allow sections of the wellfield to operate in pressure or vacuum mode or to control makeup vapor and the degree of re-injection to the vadose zone.
System Controls
The FIVE system was designed with both mechanical and electrical controls. The controls monitored parameters such as VOC concentration, temperature, and pressure at multiple points in the system. The system was designed to shut off if a high pressure situation was encountered in the process components.
Start-up Testing
During start-up testing, each individual well was developed independently to determine the maximum flow rate and vacuum that could be expected. Analytical results for vapor samples collected during start-up testing were used to predict mass extraction rates for each well. According to the vendor, during this analytical testing, the highest concentrations of the target compounds were found in the deep screen intervals of the nested wells to the north and west of the north burn pit.
Operating Modes
Subsurface flow in the vadose zone was controlled by directing vapor transport between injection (pressure mode) and extraction (vacuum mode) wells on opposite sides of the burn pits, and by controlling flow between adjacent nested wells. All peripheral wells (SVW-1, 2, 3, 4, 5, 10, 11, 12, 13, 16, 17, 20, 21, 22, 23, and 24) were operated in vacuum mode. Interior wells (SVW-6, 7, 8, 9, 18, and 19) were operated alternately in pressure and vacuum modes. Horizontal well SVW-14, near the bottom of the North Burn Pit, was primarily operated in pressure mode to drive volatile contaminants laterally to adjacent vertical wells operated in vacuum mode. In general, air was injected at 25-50% of capacity.
System Shutdown
System operation continued from May 1994 through January 1995. In July 1994, the system was shut down for a one-week period due to a carbon changeout from the granular activated carbon vessels. In addition, the system was shut down from January 18 until March 16, 1995 to assess rebound of TCE, PCE, and 1,2-DCE in soil vapor monitoring wells. The system was operated again from March through September 1995. System shutdown took place in September 1995, and confirmatory soil borings were collected at that time.
The major operating parameters affecting cost or performance for this technology and the values measured for each are shown in Table 4.
Table 4. Operating Parameters [12]
| Parameter |
Value |
Measurement Method |
|---|---|---|
| Air Flow Rate | 1,400 scfm |
N/A |
| Operating Pressure/Vacuum | 8 inches Hg |
N/A |
N/A - Measurement method not reported for this parameter because resulting value not expected to vary among measurement procedures.
A timeline for this application is shown in Table 5.
Table 5. Timeline [4, 5, 12]
| Start Date |
End Date |
Activity |
|---|---|---|
| August 1987 |
- |
SAAD placed on NPL |
| March 1993 |
- |
ROD signed for Burn Pits Operable Unit |
| January 1994 |
April 1994 |
SVE system construction and well installation |
| April 1994 |
- |
Start-up testing |
| May 1994 |
January 1995 |
System operation |
| January 18, 1995 |
March 16, 1995 |
System operation shutdown |
| March 1995 |
September 1995 |
System operation |
| September 1995 |
- |
Confirmatory soil borings |
| August 1995 |
September 1995 |
Demobilization |
Back to Matrix Description | Table of Contents | Forward to Treatment System Performance
The ROD for the Burn Pits Operable Unit identified the following soil
cleanup standards for the SVE application [1]:
In addition, the following soil vapor goals (referred to as "initial
soil vapor target goals") were calculated by the basewide contractor to
assess remediation progress [4]:
OHM stated the following as an interim requirement for wellhead equilibrium
vapor concentrations [6]:
OHM reported that the following air emission rate limits were identified for
this application [12]:
The soil cleanup goals were developed based on a risk assessment which
considered the following as the primary potential future risks to public
health:
According to the vendor, the air emission rate limits were developed based on a risk-based analysis with a target cancer risk criterion of 1 x 10⁻⁶, with a “100 fold” margin of safety. [12]
Treatment performance data for the SVE application at the Burn Pits Operable Unit consists of confirmation soil borings, soil vapor sampling (from the SEAMIST wells), mass extraction data, and extraction well vapor concentrations.
Confirmatory Soil Borings [6, 10, 11, 12]
In September 1995, OHM collected 21 confirmation soil borings from 8 locations near the burn pits, at depths ranging from 20 to 80 feet bgs. The borings were analyzed for TCE, PCE, trans-1,2-DCE, and cis-1,2-DCE. Figure 5 shows the location of the confirmation borings relative to the burn pits at SAAD, and Table 6 shows the results on a dry-weight basis for the four constituents measured in the 21 confirmation soil borings. In addition, Table 6 shows the boring number, depth, and sample identification number. As shown on Table 6, OHM calculated the "statistical mean" (average) result for each constituent in the 21 confirmation soil borings. For analytical results reported as less than the detection limit, OHM assumed a value of one-half the reported detection limit for computing the average value (e.g., for a sample reported as less than 0.002 mg/kg, OHM assumed an actual value of 0.001 mg/kg). Also as shown in Table 6, OHM calculated the average both with and without the quality control (QC) sample results. With the QC results, the average for the four constituents ranged from 0.0013 to 0.0021 mg/kg, and without the QC results the average ranged from 0.001 to 0.0016 mg/kg.
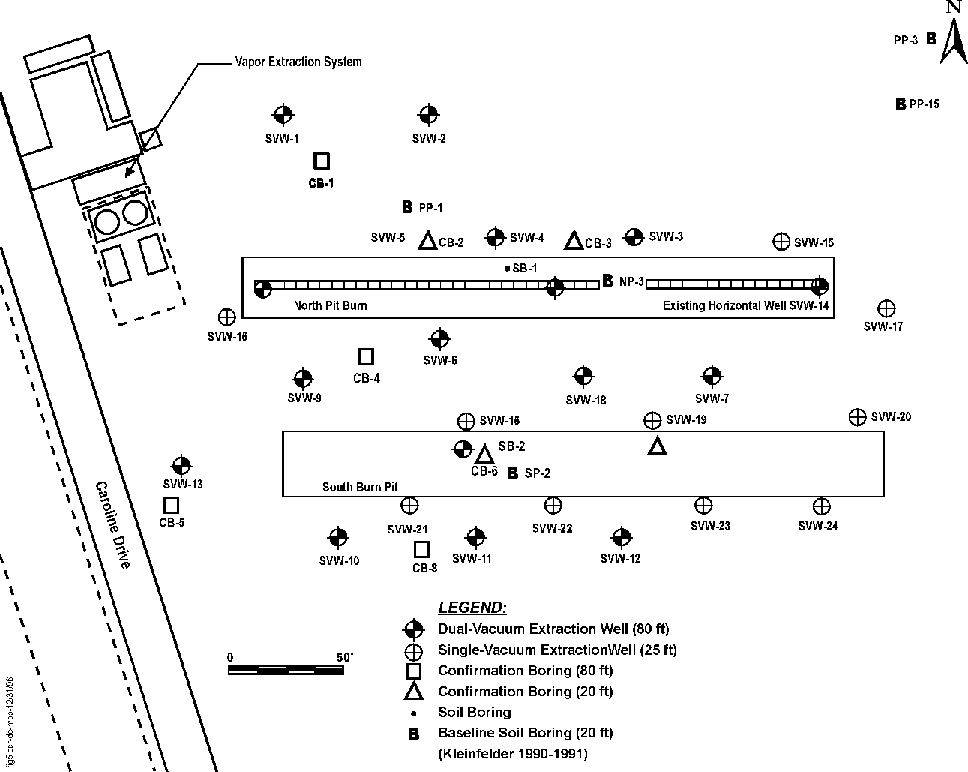
Figure 5. Location of Confirmation Soil Borings [12]
Table 6. Dry Weight Analytical Results for Confirmation Soil Boring Samples [12]
|
|
Analyte Concentration (mg/kg) |
|||||
|---|---|---|---|---|---|---|
| |
|
|
|
|
1,2 Trans-DCE |
1,2 cis-DCE |
| CB1 |
20 |
SAADCB1-20 |
<0.002 |
<0.002 |
<0.002 |
<0.002 |
| CB1 |
39 |
SAADCB1-39 |
<0.002 |
<0.002 |
<0.002 |
0.005 |
| CB1 |
60 |
SAADCB1-60 |
<0.002 |
<0.002 |
<0.002 |
<0.002 |
| CB1 |
78 |
SAADCB1-78 |
<0.002 |
<0.002 |
<0.002 |
<0.002 |
| CB2 |
20 |
SAADCB2-20 |
<0.002 |
<0.002 |
<0.002 |
<0.002 |
| CB2 |
20 |
SAADCB2-20QC |
<0.006 |
<0.006 |
<0.006 |
<0.006 |
| CB4 |
20 |
SAADCB3-20 |
<0.002 |
<0.002 |
<0.002 |
<0.002 |
| CB4 |
20 |
SAADCB4-20 |
<0.002 |
<0.002 |
<0.002 |
<0.002 |
| CB4 |
40 |
SAADCB4-40 |
<0.002 |
<0.002 |
<0.002 |
<0.002 |
| CB4 |
59 |
SAADCB4-59 |
<0.002 |
<0.002 |
<0.002 |
<0.002 |
| CB5 |
78 |
SAADCB4-78 |
<0.002 |
<0.002 |
<0.002 |
<0.002 |
| CB5 |
20 |
SAADCB5-20 |
<0.002 |
<0.002 |
<0.002 |
<0.002 |
| CB5 |
41 |
SAADCB5-41 |
<0.002 |
<0.002 |
<0.002 |
<0.002 |
| CB5 |
60 |
SAADCB5-60 |
<0.002 |
<0.002 |
<0.002 |
<0.002 |
| CB6 |
78 |
SAADCB5-78 |
0.010 |
<0.002 |
<0.002 |
<0.002 |
| CB7 |
78 |
SAADCB5-78QC |
<0.007 |
<0.007 |
<0.007 |
<0.007 |
| CB8 |
20 |
SAADCB6-20 |
<0.002 |
<0.002 |
<0.002 |
<0.002 |
| CB8 |
20 |
SAADCB7-20 |
<0.002 |
<0.002 |
<0.002 |
<0.002 |
| CB8 |
20 |
SAADCB8-20 |
<0.002 |
<0.002 |
<0.002 |
<0.002 |
| CB8 |
39 |
SAADCB8-39 |
<0.002 |
<0.002 |
<0.002 |
<0.002 |
| CB8 |
59 |
SAADCB8-59 |
<0.002 |
<0.002 |
<0.002 |
<0.002 |
| CB8 |
59 |
SAADCB8-B |
0.003 |
<0.002 |
<0.002 |
<0.002 |
| CB8 |
78 |
SAADCB8-78 |
0.003 |
<0.002 |
<0.002 |
<0.002 |
| CB8 |
78 |
SAADCB8-78QC |
0.011 |
<0.008 |
<0.008 |
<0.008 |
| Statistical Mean* (with QC Results) |
0.0021 |
0.0013 |
0.0013 |
0.0015 |
||
| Statistical Mean* (without QC Results) |
0.0016 |
0.001 |
0.001 |
0.0012 |
||
*Mean (average) values calculated assuming results reported as less than detection limit were present at one-half detection limit.
Soil Vapor Sampling [4]
To assess the progress of the remediation, soil vapor samples were collected from six SEAMIST wells. As shown in Figure 3, the six SEAMIST wells were located throughout the soil vapor extraction wellfield. Five SEAMIST wells contained 10 sample ports each, and one well contained 9 ports. The sample ports in each SEAMIST well were vertically distributed in the primary stratigraphic units determined from site investigation borings and well logs. Figure 6 shows a SEAMIST well construction detail, and Table 7 shows the sample port depths for the six wells.
The SEAMIST well vapor samples were collected in 1-liter Summa™ canisters and analyzed for TCE, PCE, and 1,2-DCE using a modified EPA Method TO-14. Table 8 shows the range of soil vapor concentrations for TCE, PCE, and 1,2-DCE before and during shutdown (on January 18, 1995 and February 28, 1995) in the six SEAMIST wells. In addition, Table 8 shows the range of baseline concentrations for TCE in soil vapor in April 1994, prior to SVE system startup.
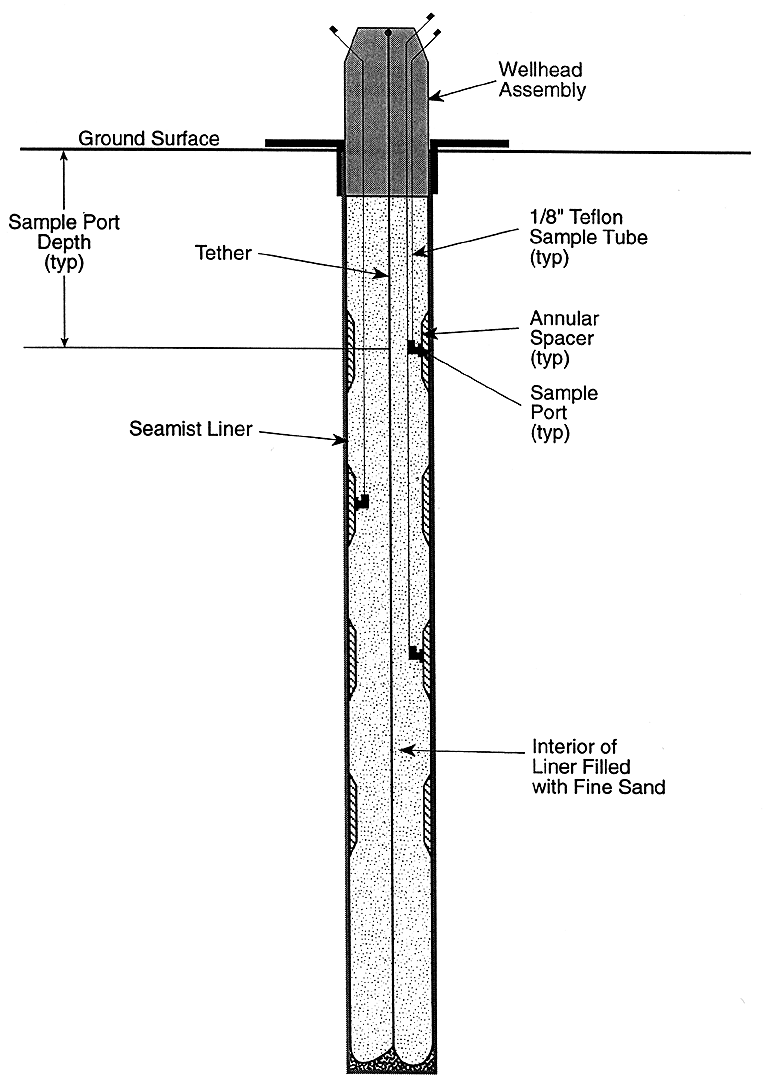
Figure 6. Seamist Well Construction Detail [4]
Table 7. Sample Port Depths for SEAMIST Wells [4]
|
|
Sample Port |
|||||||||
|---|---|---|---|---|---|---|---|---|---|---|
| Well |
1 |
2 |
3 |
4 |
5 |
6 |
7 |
8 |
9 |
10 |
| ID |
Depth (feet) |
|||||||||
| SM-1 |
8 |
18 |
31 |
37 |
44 |
53 |
60 |
66 |
72 |
77 |
N/A - Not applicable; well SM-2 had only 9 sample ports.
Table 8. Range of Soil Vapor Concentrations Before and During Shutdown [4]
| Compound |
Initial Soil Vapor Target Goal (µg/L) |
Baseline
Concentrations (April 1994) |
Before Shutdown Concentrations (January 18, 1995) (µg/L) |
During Shutdown Concentrations (February 28, 1995) (µg/L) |
|---|---|---|---|---|
| Trichloroethene (TCE) | 1.88 |
0.4 - 199.6 |
ND - 12.9 |
ND - 7.6 |
| Tetrachloroethene (PCE) | 3.14 |
N/A |
ND |
ND |
| 1,2-Dichloroethene (1,2-DCE) | 8.11 |
N/A |
ND - 2.9 |
ND - 3.3 |
N/A - Data not available
ND - Not detected (detection limit not provided).
Extraction Well Vapor Concentrations [6, 12]
Extraction well vapor concentrations were measured in February 1994 during drilling of wells at depths of 20 to 25, 45, 55, 65, and 75 feet bgs. A metal probe containing well screen openings at its tip was hydraulically thrust into the soil ahead of the augers. The probe was connected to Teflon™ tubing which extended up to the surface. The Teflon™ tubing was purged of air prior to collection of a vapor sample. After purging, the Teflon™ tubing was attached to a Tedlar bag within a vacuum chamber. As the chamber was evacuated by an air pump, the bag filled with soil gas. To prevent cross-contamination, the equipment was cleaned and new Teflon™ tubing was used to collect each sample.
Vapor analyses were conducted both at an on-site laboratory and by a third party laboratory. The maximum concentrations of TCE, PCE, and 1,2-DCE measured during drilling of the shallow and deep wells, reported by the off-site laboratory, are shown in Table 9. The highest concentrations of TCE, PCE, and 1,2-DCE were generally found at approximately 50 to 60 feet bgs and 70 to 80 feet bgs. In addition, Table 9 shows the interim results from July 1994 (system operation began in May 1994) at the wellheads for TCE, PCE, and 1,2-DCE.
Table 9. Concentrations in Extraction Well Vapors [6, 12]
| Maximum During Drilling (mg/kg) |
||||
|---|---|---|---|---|
| |
Vendor Interim Requirement (goal) (mg/kg) |
|
|
Interim Results at Wellheads - July 1994 (mg/kg) |
| Trichloroethene (TCE) | 1.7 |
3.248 |
10.37 |
0.41 |
| Tetrachloroethene (PCE) | 1.7 |
0.665 |
3.422 |
0.20 |
| 1,2-Dichloroethene (1,2-DCE) | 0.7 |
2.4 |
4.1 |
0.58 |
The mass extraction (removal) rates of TCE, PCE, and 1,2-DCE over the first six months of system operation are shown in Figure 7. The cumulative mass of TCE, PCE, and 1,2-DCE removed over this six-month period is presented in Figure 8. Tables 10 and 11 show the data used to prepare Figures 7 and 8, respectively, for the run times from 42 to 170 days, and for day 346.
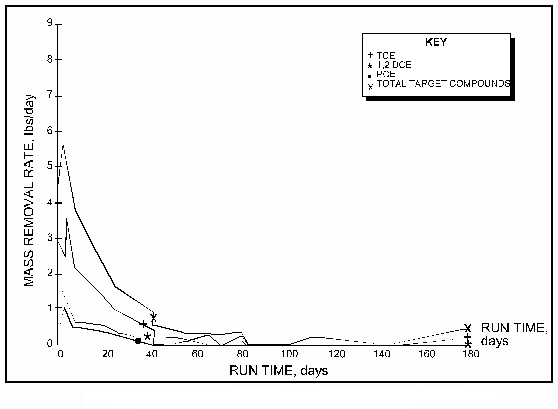
Figure 7. Mass Removal Rates of TCE, PCE, and 1,2-DCE [6]
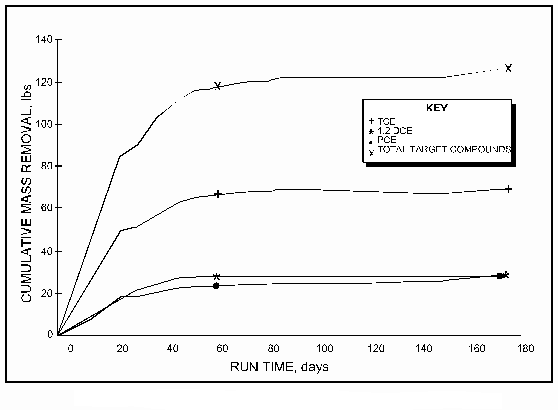
Figure 8. Cumulative Mass Extracted of TCE, PCE, and 1,2-DCE [6]
Note that Tables 10 and 11 do not show the removals from the beginning of system operation through the 42nd day of run time (these data were not provided by the vendor).
Air Emissions [12]
Table 10 shows the air emissions from system operation at the outlet from the secondary carbon unit. As shown in Table 10, for the run times from 42 to 170 days, the actual air emissions ranged from 0 to 0.51 lbs/day, shown as a total for the three target compounds. Actual air emissions were not provided by the vendor for the run time from 0 to 42 days. Table 10. Mass Removal Rates of TCE, PCE, and 1,2-DCE [12]
Table 10. Mass Removal Rates of TCE, PCE, and 1,2-DCE [12]
| TCE |
PCE |
1,2-DCE |
|||||||
|---|---|---|---|---|---|---|---|---|---|
| |
Inlet to Primary Carbon (lbs/day) |
Outlet from Secondary Carbon (lbs/day) |
Amount Removed by Carbon (lbs/day) |
Inlet to Primary Carbon (lbs/day) |
Outlet from Secondary Carbon (lbs/day) |
Amount Removed by Carbon (lbs/day) |
Inlet to Primary Carbon (lbs/day) |
Outlet from Secondary Carbon (lbs/day) |
Amount Removed by Carbon (lbs/day) |
| Air Emission Limit | - |
0.103 |
- |
- |
0.072 |
- |
- |
0.072 |
- |
| 42.05 | 0.34 |
0 |
0.34 |
0.19 |
0 |
0.19 |
0.16 |
0.18 |
(0.02)** |
| 48.58 | 0.29 |
0 |
0.29 |
0 |
0 |
0 |
0.06 |
0.24 |
(0.18)** |
| 54.56 | 0.1 |
0 |
0.1 |
0.05 |
0 |
0.05 |
0.07 |
0.3 |
(0.23)** |
| 63.5 | 0.15 |
0 |
0.15 |
0 |
0 |
0 |
0 |
0.42 |
(0.42)** |
| 69.5 | 0 |
0 |
0 |
0 |
0 |
0 |
0.08 |
0.51 |
(0.43)** |
| 78.5 | 0.05 |
0 |
0.05 |
0.12 |
0 |
0.12 |
0 |
0.23 |
(0.23)** |
| 82.5 | 0 |
0 |
0 |
0 |
0 |
0 |
0 |
0.29 |
(0.29)** |
| 91.53 | 0 |
0 |
0 |
0 |
0 |
0 |
0 |
0 |
0 |
| 99.54 | 0 |
0 |
0 |
0 |
0 |
0 |
0 |
0.08 |
(0.08)** |
| 109.87 | 0 |
0 |
0 |
0.11 |
0 |
0.11 |
0 |
0.08 |
(0.08)** |
| 140.52 | 0 |
0.09 |
(0.09)** |
0 |
0 |
0 |
0 |
0 |
0 |
| 147.63 | 0 |
0 |
0 |
0 |
0 |
0 |
0 |
0 |
0 |
| 172.58 | 0.15 |
0.1 |
0.05 |
0.21 |
0.06 |
0.15 |
0 |
0 |
0 |
| 346.60 | 0 |
0 |
0 |
0 |
0 |
0 |
0 |
0 |
0 |
*Cumulative run time as shown for inlet to primary carbon unit
**Values shown in parentheses ( ) indicate that the quantity in the outlet from
the secondary carbon was greater than the quantity in the inlet to the primary
carbon.
Table 11. Cumulative Mass Extracted of TCE, PCE, and 1,2-DCE* [12]
| Cumulative Run Time (days) |
TCE |
PCE |
DCE |
Total Target Compounds (lbs) |
|---|---|---|---|---|
| 42.05 | 62.97 |
22.84 |
26.62 |
112.43 |
| 48.58 | 64.86 |
23.45 |
27.25 |
115.56 |
| 54.56 | 66.01 |
23.6 |
27.63 |
117.24 |
| 63.5 | 67.09 |
28.8 |
27.91 |
123.8 |
| 69.5 | 67.55 |
23.81 |
28.15 |
119.51 |
| 78.5 | 67.77 |
24.35 |
28.52 |
120.64 |
| 82.5 | 67.87 |
24.6 |
28.52 |
120.99 |
| 91.53 | 67.87 |
24.6 |
28.52 |
120.99 |
| 99.54 | 67.87 |
24.6 |
28.52 |
120.99 |
| 109.87 | 67.87 |
25.17 |
28.52 |
121.56 |
| 140.52 | 67.87 |
26.88 |
28.52 |
123.27 |
| 147.63 | 67.87 |
26.88 |
28.52 |
123.27 |
| 172.58 | 69.7 |
29.5 |
28.52 |
127.72 |
| 346.60 | 73.86 |
35.12 |
28.61 |
137.6 |
*Data reported for inlet to primary carbon unit; cumulative run time for blower no. 7681.
The FIVE system achieved the specified soil cleanup goals for all three target constituents - TCE, PCE, and 1,2-DCE. As shown on Table 6, the average value for the 21 confirmation soil borings was less than the cleanup goals of 0.005 mg/kg for TCE, PCE, and 1,2-DCE. Table 6 shows that the average TCE value was 0.0021 mg/kg, PCE was 0.0013 mg/kg, and 1,2-DCE was 0.0028. (These values include the QC samples; the average results without the QC samples are slightly lower.) As shown on Table 6, OHM reported the 1,2-DCE values separately for the trans and cis isomers of this constituent; however, these results were added together to compare with the cleanup standard. Of the 96 analytical values shown on Table 6, only two (TCE in SAADCB5-78 at 0.010 mg/kg and in SAADCB8-78QC at 0.011 mg/kg) were greater than the target cleanup goal of 0.005 mg/kg. In addition, only 5 of the 96 values were reported as detected values; the remainder were all reported as not-detects with a detection limit ranging from 0.002 to 0.008 mg/kg.
There were a limited quantity of soil vapor data collected during this application, with samples collected at “baseline” (April 1994), before shutdown (January 1995), and during shutdown (February 1995). Based on these limited data, it appears that the TCE soil vapor concentration was greater than the soil vapor target goal, PCE (at ND), and 1,2-DCE (at a maximum of 3.3 µg/L) appear to have met their soil vapor target goals.
In addition, there were a limited quantity of extraction well vapor data collected during this application, with samples collected during drilling and in July 1994. The data in Table 9 show that the interim results at the wellheads for July 1994 met the vendor’s interim requirement (goal) for all three target contaminants.
The vendor indicated that the FIVE technology is intended to produce relatively larger subsurface pressure gradients and higher flow rates of extracted vapors than would be achieved solely with using vapor extraction technology. The vendor stated that this process “enhanced subsurface volatilization and shortened the period of remediation” [6], however, no data were provided to support this statement. For example, the vendor did not estimate how much additional time would have been required to reach the cleanup goals solely using vapor extraction technology.
Figures 8 and 9 show rapid extraction of target VOCs during the first 40 days of system operation, and more gradual extraction over the next 140 days. For example, the mass extraction rates decreased by more than 75% from an average of 4 pounds per day (lbs/day) over the first 20 days of system run time to less than 1 lb/day after 40 days of system run time. As shown in Table 11, the cumulative quantity of contaminant extracted from the subsurface over 347 days of run time was approximately 138 lbs, consisting of 74 lbs of TCE, 35 lbs of PCE, and 29 lbs of 1,2-DCE. More than 80% of the total mass was extracted during the first 42 days of run time, and almost 93% of the total mass was extracted during the first 173 days. More than half of the total mass extracted was TCE, and the remainder consisted of nearly equal quantities of PCE and 1,2-DCE.
The 138 lbs of target VOCs extracted during system operation is approximately two times greater than the originally estimated mass of TCE, PCE, and 1,2-DCE existing beneath the site. The quantity of TCE extracted is more than three times greater than the original estimate. Possible reasons identified by the treatment vendor include inaccuracies in the original estimate, and, for 1,2-DCE, a reductive dehalogenation mechanism that took place in situ.
The data in Table 10 show that air emissions (as measured at the outlet from secondary carbon) from days 42 through 172 sometimes were greater than the limits described above. TCE and PCE met their air emission limits, however, 1,2-DCE exceeded its air emission limit. For example, on Day 42, 1,2-DCE was emitted at a rate of 0.18 lbs/day, which is greater than the limit of 0.072 lbs/day. 1,2-DCE emissions from run time 42 to 172 days ranged from 0.08 to 0.51 lbs/day, exceeding the emissions limit on nine sampling dates.
The data in Table 10 also show that the carbon columns were not effective in removing 1,2-DCE from the extracted air, in that more DCE was released from the carbon than was extracted from the subsurface. Based on a sum of the daily inlet and outlet quantities from run times 42 to 172 days, the carbon showed an average TCE removal rate of 82%, and for PCE of 91%. Note that because the carbon was not effective in removing 1,2-DCE, the calculation of the cumulative amount removed by carbon for the three target contaminants is a negative number.
Analytical data are available for the following: 1) the concentrations of contaminants in the soil prior to treatment; 2) the concentrations of contaminants in soil vapors and extraction well vapors; 3) mass extraction rate and cumulative mass extraction data; 4) soil boring confirmation samples measuring concentrations of contaminants in the soil after treatment; and 5) air emissions from the carbon units.
The treatment vendor reported that confirmation soil borings were analyzed using standard EPA methods 8240, 8270, and 8080, and that three duplicate field samples were collected and analyzed. The field duplicates confirmed that the target analytes were below detected values, however the detection limits for the duplicates were 3 to 4 times greater than those for the original samples. No additional information was provided on why the detection limits were higher for the field duplicates. [12]
Back to Treatment System Description | Table of Contents | Forward to Treatment System Cost
OHM was awarded a contract by the USACE, Sacramento District, for the design, construction, and operation of an enhanced SVE system with pressurized injection. [5] According to the vendor, the procurement was a "non-programmatic open governmental bidding process". [12] No information was provided on the number of bidders or the basis for selecting OHM as the treatment vendor.
Kleinfelder provided support to the Army at SAAD under a basewide contract, and was tasked by the USACE, Sacramento District, with monthly sampling of monitoring wells during OHM's operation, and other activities. [4]
OHM reported a total cost of $865,873 for this application. In order to standardize reporting of costs across projects, the costs were broken down according to the format for an interagency Work Breakdown Structure (WBS). The WBS specifies 9 before-treatment cost elements, 5 after-treatment cost elements, and 12 cost elements that provide a detailed breakdown of costs directly associated with treatment.
Following the WBS, the total cost reported by OHM was broken down in before-treatment costs, shown in Table 12, and costs directly attributed to treatment activities, shown in Table 13. No costs were incurred for after-treatment activities in this application. Tables 12 and 13 present the cost elements exactly as they appear in the WBS. As shown in Table 12, approximately $195,000 were expended in before-treatment costs for drilling, soil gas survey, confirmatory boring, and chemical testing. Table 13 shows that approximately $670,500 were expended for activities directly attributed to treatment, such as design, mobilization, construction, start-up/testing/permitting, SVE operations and maintenance, disposal of carbon, and demobilization.
The $670,500 in costs directly attributed to treatment corresponds to $2.70 per cubic yard of soil treated (247,900 cubic yards) and $4,858 per pound of target VOC removed (for the 138 pounds of TCE, PCE, and 1,2-DCE removed,).
Table 12. Before-Treatment Costs [5]
| Cost Element |
Cost ($) |
|---|---|
| Monitoring, Sampling, Testing, and Analysis - drilling/soil/gas survey: $161,497 - confirmatory borings (including chemical testing): $33,865 |
195,362 |
Table 13. Costs Directly Attributed to Treatment [5, 12]
| Cost Element | Cost ($) |
|---|---|
| Mobilization/Setup - design package: $44,486 - mobilization/construction: $159,877 |
204,363 |
| Startup/Testing/Permits | 26,764 |
| Operation (short-term - up to 3 years) | 418,812 |
| Demobilization | 20,572 |
| Total |
670,511 |
The costs described above represent actual costs for this treatment application as reported by OHM. Limited information is available on the specific activities included within the cost elements for monitoring, sampling, testing, and analysis, and mobilization/setup. No information is available on the specific activities included within the other reported cost elements.
OHM reported that costs for similar projects can be reduced by the following
methods [12]:
Back to Treatment System Performance | Table of Contents | Forward to Observations and Lessons Learned
Back to Treatment System Cost | Table of Contents | Forward to References
This case study was prepared for the U.S. Environmental Protection Agency's Office of Solid Waste and Emergency Response, Technology Innovation Office. Assistance was provided by Radian International LLC under EPA Contract No. 68-W3-0001 and U.S. Army Corps of Engineers Contract No. DACA45-96-D-0016.
Back to Observations and Lessons Learned | Table of Contents