
|
Cost and Performance Report:
|
Back to References | Table of Contents
Summary
| Identifying Information | |
| Site Location: | Hastings, Nebraska |
| ROD Date: | 9/26/89 |
| Historical Activity at Site - SIC Codes: | 0723A (Crop Preparation Services for Market Except Cotton Ginning - Grain Fumigation) |
| Historical Activity at Site - Management Practices: | Spill/Contaminated Aquifer |
| Site Contaminants: | Carbon Tetrachloride (CCl4 ) and Chloroform |
| Type of Action: | Remedial |
| Did ROD include a contingency based on treatability study results? | No |
| Treatability Study Information | |
| Type of Treatability Study: | Pilot |
| Duration of Treatability Study: | 4/15/91 to 5/9/91 |
| Media Treated: | Soil (in situ) |
| Quantity Treated: | 45 pounds of VOCs removed |
| Treatment Technology: | Soil Vapor Extraction (SVE) Four extraction wells (two deep and two shallow were followed by an air/water spearator, a vacuum pump blower, and two activated carbon canisters |
| Target Contaminant of Concern: | Carbon Tetrachloride |
| Conducted before the ROD was signed: | No |
| Additional treatability studies conducted: | No |
| Technology selected for full-scale application: | Yes |
| Treatability Study Strategy | |
| Number of Runs: | Three operational tests (step, steady-state, and gas tracer) were performed |
| Key Operating Parameters Varied: | Vacuum applied, treatment time, air flow rate |
| Treatability Study Results | |
| Mass of Contaminants Removed: | 45 pounds of CCl4 and chloroform from four wells |
| Pre-test Soil Vapor Concentrations: (measured by on-site laboratory) | 0.3 µg/L to 440 µg/L of CCl4 0.01 µg/L to 250 µg/L of chloroform |
| Post-test Soil Vapor Concentrations: (measured by on-site laboratory) | Non-detectable to 2.0 µg/L of CCI4 0.002 µg/L to 2.0 µg/L of chloroform |
| Correlation of Operating Parameters with Performance Data | Greater treatment time resulted in higher mass of contaminant removed; removal of contaminants was higher in deep wells compared to shallow wells |
Treatability Study Strategy
Treatability Study Purpose [4]
The overall purposes of the pilot-scale treatability study were to:
- Collect data on the removal rate of carbon tetrachloride (CCl4) and chloroform by the pilot SVE system in order to develop full-scale treatment system design criteria; and
- Collect data to project time and effectiveness of full-scale treatment system performance of the SVE system.
Specific objectives of the treatability study included determination of well spacing and well screening intervals for full-scale application, evaluation of full-scale flow rate, vacuum and granular activated carbon (GAC) requirements, estimation of cost and time required for full-scale remediation, and collection of additional subsurface condition data that could affect full-scale design. In addition, concentrations of CCl4 and chloroform in the extracted soil vapor was also measured.
Treatment System Description
Treatment System Description and Operation [4]
Treatment System Description
As shown in Figure A-1, the SVE pilot treatment system included four vapor extraction wells and two monitoring wells. Two extraction wells (SVE-1S and SVE-2S) were designed to study the shallow zone, and two extraction wells (SVE-1D and SVE-2D) were designed to study the deep zone.
Figure A-1. SVE Test Cell Layout [4]
Shallow and deep monitoring wells (MP-1S and MP-1D) were 4 inches in diameter and equipped with several probes at various depths. The well casings were schedule 80, polyvinyl chloride (PVC) casings with 0.01-inch slot wire wrapped stainless steel screens, except for SVE-1S which had a 0.01-inch PVC screen. As shown in Figure A-2, the extraction wells were piped to an air/water separator, vacuum pump/blower, and two 1,000-lb activated carbon canisters. The treated vapors were discharged to the air through a 20-foot high stack.
Figure A-2. General Schematic of the SVE Treatment System [4]
Operational Tests
Three operational tests (step, steady-state, and gas tracer) were performed for 10 days on each well within the shallow and deep zones. During the tests, the vacuum was varied to optimize performance of the shallow and deep wells. The step test was conducted by pumping each well at incrementally increasing vacuums to observe the flow rate response. Results of the step test were used to determine a flow rate for the second phase, a steady-state test. The step test results were also used to establish design criteria for extraction wells, pumping, and vapor treatment equipment required for full-scale remediation. The steady-state test was conducted, per the conditions determined in the step test, to study removal rate of contaminants (CCl4 and chloroform). At the end of the steady-state test, the gas tracer test was conducted to evaluate soil gas velocities and to calculate permeability to air.
Wells SVE-1D and SVE-1S were operated for approximately 200 hours each and wells SVE-2D and SVE-2S were operated for approximately 50 hours each. A total of 45 pounds of volatile organic compounds were captured by the granular activated carbon system during the treatability study.
Pretest, operational, and post-test sampling and analysis were performed by both on-site (Close Support Laboratory or CSL) and off-site laboratories (Contract Laboratory Program or CLP). Samples of soil, extracted soil vapor, carbon outlet gas, and water from the air/water separator were also collected and analyzed. Syringe samples were collected for analysis by the CSL, canister samples were collected for analysis by CLP.
Procurement Process/Treatability Study Cost [4]
Morrison-Knudsen Corporation Environmental Services, under Alternative Remedial Contracts Strategy (ARCS) Contract Number 68-W9-0025, in conjunction with EPA Region VII, EPA Ada Laboratory, and the NDEQ, conducted the treatability study as the first phase of the Remedial Design of the Hastings Well Number 3 Subsite. The cost of the treatability study and remedial design was approximately $400,000. Projected full-scale treatment costs are discussed below.
Treatability Study Results
Operating Parameters and Performance Data [4]
The operating parameters for the step and steady-state tests conducted during the treatability study are shown in Table A-1.
Table A-1. Operating Parameters for the
Pilot-Scale SVE Treatability Study
at the Hastings Well Number 3 Subsite [4]
| Operational Test | SVE-1D | SVE-2D | SVE-1S | SVE-2S |
| Step Test (Up) Applied Vacuum at Well Head (in. Hg) | 2.85 5.30 6.92 8.55 11.41 11.81 |
2.85 6.21 9.19 12.63 |
3.06 6.52 9.37 12.63 14.66 12.02 |
- - - - - - |
| Step Test (Down) Applied Vacuum at Well Head (in. Hg) | 10.08 7.33 5.70 3.26 |
- - - - |
13.85 9.17 6.52 3.06 |
- - - - |
| Observed Flow Rates at Well (scfm) | 65 (min.) 205 (max.) |
65 (min.) 175 (max.) |
48 (min.) 178 (max.) |
- - |
| Duration of Step Test (hours) | 30.17 | 6.17 | 27.43 | - |
| Steady-State Applied Vacuum at Well Head (in. Hg) |
11.8 | 11.8 | 11.4 | 13 |
| Duration of Steady-State Test (hours) | 168 | 48 | 168 | 48 |
| Total Operating Time (hours) | 198.17 | 51.17 | 195.43 | 48 |
Data on total mass removed and post-test concentrations of
CCl4 in extracted soil
vapor are presented in Figures A-3 to A-10 for the four extraction wells
(SVE-1D, SVE-2D, SVE-1S, and SVE-2S). These results are summarized in Table
A-2.
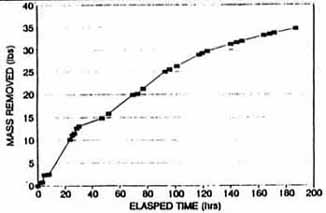
Figure A-3. Total Mass Removed in Extraction Well SVE-1D Carbon Tetrachloride
& Chloroform (Based on CSL Results) [4]
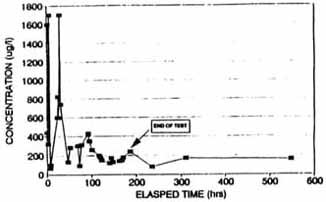
Figure A-4. Concentration of Carbon
Tetrachloride in Extraction
WEll SVE-1D (Based on CSL Reslults) [4]
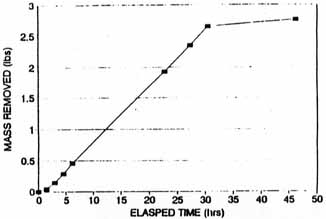
Figure A-5. Total Mass Removed in
Extraction Well SVE-2D Carbon Tetrachloride
& Chloroform (Based on CSL Results) [4]
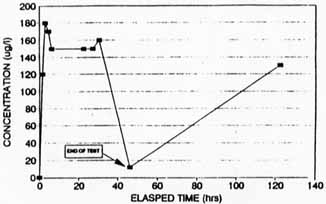
Figure A-6. Concentration of Carbon
Tetrachloride in Extraction
WEll SVE-2D (Based on CSL Reslults) [4]
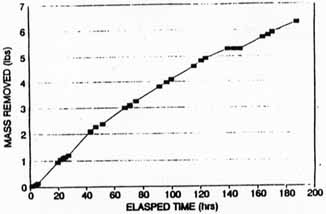
Figure A-7. Total Mass Removed in
Extraction Well SVE-1S Carbon Tetrachloride
& Chloroform (Based on CSL Results) [4]
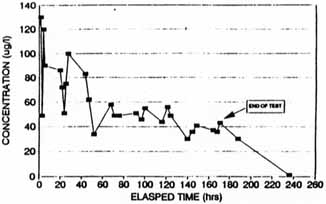
Figure A-8. Concentration of Carbon
Tetrachloride in Extraction
WEll SVE-1S (Based on CSL Reslults) [4]
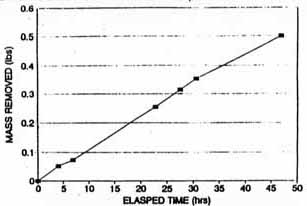
Figure A-9. Total Mass Removed in
Extraction Well SVE-2S Carbon Tetrachloride
& Chloroform (Based on CSL Results) [4]
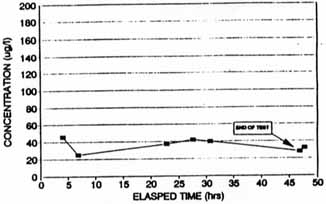
Figure A-10. Concentration of Carbon
Tetrachloride in Extraction
WEll SVE-2S (Based on CSL Reslults) [4]
Table A-2. Summary of CCl4 and Chloroform Mass Removal by the SVE System [4]
| Well | Duration of SVE System Operation (hrs) | Mass of CCl4 and Chloroform Extracted (lbs) | Post-Test Concentration (CSL) of CCl4 in Extracted Soil Vapors (g/L) |
| SVE-1D | 198.7 | 35 | 80 |
| SVE-2D | 51.17 | 3 | 12 |
| SVE-1S | 195.43 | 6 | 1.0 |
| SVE-2S | 48 | 0.5 | 32 |
| Total | -- | 44.5 | - |
CSL - Close Support Laboratory (on-site)
Table A-3 compares results of the pre-test and post-test analyses of soil vapor samples collected at the site. Results for both off-site and on-site analyses for CCl4 and chloroform are presented for samples collected from the four extraction wells and seven monitoring probe locations.
Table A-3. Comparison of Pre-Test and Post-Test Soil Vapor Concentrations of CCl4 and Chloroform [4]
| Sample Location | Pre-Test/ Post-Test |
Date | CLP Results | CSL Results | ||
| CCl4 (ug/L) | Chloroform (µg/L) |
CCl4 (ug/L) | Chloroform (µg/L |
|||
| SVE-1D | Pre-Test | 04/15/91 | 20 | 0.39 | 440 | 1 |
| Post-Test | 04/26/91 | 48 | 1.8 | 80 | 0.2 | |
| SVE-2D | Pre-Test | 04/15/91 | 100 | 1.1 | 0.3 | ND |
| Post-Test | 04/26/91 | 9.4 | 0.11 | 12 | 0.1 | |
| SVE-1S | Pre-Test | 04/15/91 | 100 | 28 | 11 | 0.12 |
| Post-Test | 04/26/91 | 1.7 | ND | 1.0 | 0.3 | |
| SVE-2S | Pre-Test | 04/15/91 | 130 | 3.1 | 40 | 2 |
| Post-Test | 04/26/91 | 48 | 1.8 | 32 | 0.9 | |
| MP-1D-D | Pre-Test | 04/15/91 | 360 | 5 | 31 | ND |
| Post-Test | 04/26/91 | 280 | 4.1 | 250 | 2.0 | |
| MP-1D-E | Pre-Test | 04/15/91 | 540 | 5.3 | 270 | 0.9 |
| Post-Test | 04/26/91 | 200 | 3.3 | 240 | 2.0 | |
| MP-1D-F | Pre-Test | 04/15/91 | 480 | 4.3 | 64 | 0.4 |
| Post-Test | 04/26/91 | 240 | 1.8 | 190 | 1.0 | |
| MP-1D-G | Pre-Test | 04/15/91 | 200 | 1.6 | 19 | 0.2 |
| Post-Test | 04/26/91 | 190 | 0.96 | 110 | 0.5 | |
| MP-1S-A | Pre-Test | 04/15/91 | 130 | 2.6 | 30 | 0.7 |
| Post-Test | 04/26/91 | ND | ND | 0.3 | 0.003 | |
| MP-1S-B | Pre-Test | 04/15/91 | 240 | 4.8 | 38 | 0.5 |
| Post-Test | 04/26/91 | ND | ND | 0.3 | 0.005 | |
| MP-1S-C | Pre-Test | 04/15/91 | 250 | 5.1 | 21 | 0.8 |
| Post-Test | 04/26/91 | ND | ND | 0.01 | 0.002 | |
CLP - Contract Laboratory Program
(off-site).
CSL - Close Support Laboratory (on-site).
ND - Not detected
Performance Data Assessment
A review of the data shown in Table A-2 indicates that a total of 38 pounds of CCl4 and chloroform were extracted from the deep wells (35 pounds from SVE-1D and 3 pounds from SVE-2D). A total of 6.5 pounds of CCl4 and chloroform were extracted from the shallow wells (6 pounds from SVE-1S and 0.5 pounds from SVE-2S). The deep well that operated for approximately 200 hours extracted 35 pounds of CCl4 and chloroform compared to the shallow well that extracted 6 pounds of contaminants, and the deep well that operated approximately 50 hours extracted 3 pounds of CCl4 and chloroform compared to the shallow well that extracted 0.5 pounds of contaminants.
Figures A-3, A-5, A-7, and A-9 indicate that removal of CCl4 and chloroform from each well increased from the start to finish of each test; however, Figures A-4, A-5, A-8, and A-10 indicate that the measured concentrations of CCl4 in the four extraction wells fluctuated throughout the SVE system operation. For example, during the steady-state test on SVE-1D, soil gas concentrations were measured as high as 1,700 µg/L and were reduced to approximately 200 µg/L after 168 hours of operation (shown on Figure A-4).
Concentrations of CCl4 measured in soil vapor samples ranged from 20 µg/L to 540 µg/L pre-test, and ranged from non-detectable to 280 µg/L post-test, as reported by CLP. As reported by CSL, CCl4 concentrations ranged from 0.3 µg/L to 440 µg/L pre-test, and ranged from 0.01 µg/L to 250 µg/L post-test.
Concentrations of chloroform measured in soil vapor samples ranged from 0.39 µg/L to 28 µg/L pre-test, and ranged from non-detectable to 4.1 µg/L post-test, as reported by CLP. As reported by CSL, chloroform concentrations ranged from non-detectable to 2 µg/L pre-test, and ranged from 0.002 µg/L to 2.0 µg/L post-test.
Soil gas ranges in pre-test/post-test soil vapor sample analyses as reported by CLP indicate that concentrations of CCl4 and chloroform decreased in ten of the eleven locations tested as reported by CLP. Concentrations decreased for only seven of the eleven CCl4 samples, and for four of the eleven chloroform samples, as reported by CSL.
Performance Data Completeness
Data characterize concentrations of contaminants in soil vapors from each extraction well over the course of the treatability study, and show how treatment performance varies with operating conditions of the SVE system.
Performance Data Quality [4]
Quality assurance procedures of the on-site laboratory included decontamination procedures for sample equipment, calibration checks on analytical equipment, use of calibration standards, analysis of water blanks, and use of EPA audit samples. Off-site analyses were performed as specified by the CLP program. No exceptions to the QA/QC protocol were noted by the vendor.
Projected Full-Scale Treatment Application Design [2]
A preliminary design for a full-scale SVE treatment system was provided by Morrison-Knudsen, based on the results of the treatability study, as shown in Table A-4. The full-scale system was designed to include three new deep and intermediate extraction wells and three new deep monitoring probes in addition to the existing pilot-scale SVE system. One shallow well was intended to be replaced by a new shallow well; otherwise, the entire pilot-scale system was intended to be used in full-scale treatment application.
Table A-4. Preliminary Design for Full-Scale SVE System at the Hastings Well Number 3 Subsite [2]
| Design Parameter | Value |
| Extraction Wells | |
| Screened intervals of three wells: | 20-40 feet (shallow) 50-80 feet (intermediate) 80-110 feet (deep) |
| Radius of influence: | 100 feet |
| Wellhead vacuum: | 3 in. Hg |
| Flow Rate per well pair: | 300 scfm |
| Well Diameter: | 4 inches |
| Soil Gas Conditions at Wellhead | |
| Carbon tetrachloride, maximum: | 1,800 µg/L |
| Carbon tetrachloride, average: | 100 µg/L |
| Chloroform, maximum: | 30 µg/L |
| Chloroform, average: | 3 µg/L |
| Temperature: | 50° F |
| Relative humidity: | 100% |
| Pressure, absolute: | 25 in. Hg |
| Maximum total flow rate: | 900 scfm 1,300 acfm |
| GAC System Criteria | |
| Removal capacity: | 0.2 lb CCl4 /lb GAC |
| Maximum total flow rate: | 1,300 acfm |
| Number of adsorbers per stage: | 3 |
| Number of stages: | 2 |
| Total number of adsorbers: | 6 |
| Adsorber diameter: | 42"" min. |
| Adsorber face velocity: | 60 ft/min (max) |
| Mass of GAC per adsorber: | 1,000 lb |
| Total mass of GAC: | 6,000 hr |
| Total adsorber capacity: | 1,200 lb CCl4 |
| Vacuum Pump Criteria | |
| Maximum total flow rate: | 900 scfm 1,300 acfm |
| Inlet vacuum: | 9 in. Hg |
| Inlet temperature: | 70° F |
| Outlet pressure: | 23 in. H2O |
| Site Design Conditions | |
| Elevation: | 1,900 ft |
| Barometric pressure: | 28 in. Hg |
| Wind loading: | 80 mph |
| Mean ambient temperature: | 50° F |
| Minimum ambient temperature: | -30° F |
| Maximum ambient temperature: | 110° F |
SVE was implemented at the Hastings Well Number 3 Subsite. The preceding report presents observations and lessons learned concerning the full-scale application, including observations concerning the results of the treatability study.
Projected Full-Scale Cost [2, 4]
Table A-5 presents estimated costs for construction and a nine-month shakedown period at the Hastings Well Number 3 Subsite. A complete breakdown of these costs was not presented in the available documentation.
Full-scale treatment activities were anticipated to require 1.5 to 2 years, with system shutdowns every three months for system performance evaluation. However, the subsequent full-scale activities did not require this length of time to achieve the treatment goals.
Table A-5. Projected Full-Scale Cost of Soil Vapor Extraction at the Hastings Well number 3 Subsite* [2]
| Capital Costs | |
| Item | Estimated Costs |
| Granular Activated Carbon | $14,882 |
| Modular Equipment | $82,162 |
| Capital Cost Subtotal | $97,044 |
| Operation and Maintenance (O&M) Costs | |
| Item | Estimated Costs |
| Construction | $102,223 |
| Architect/Engineer Construction Services | $106,448 |
| Nine-Month Shakedown O&M | $141,925 |
| O&M Cost Subtotal | $350,596 |
| TOTAL COST FOR CONSTRUCTION AND SHAKEDOWN | $447,640 |
*These costs address remedial construction and a nine-month shakedown period. No costs for operation and maintenance of the SVE system were provided in the available documentation.
Observations and Lessons Learned
Back to References | Table of Contents
2. Morrison-Knudsen Corporation. Preliminary
Design Report for a Soil Vapor Extraction System, Well Number 3 Subsite,
Revision 1, U.S. EPA ARCS, September 1991.
4. Morrison-Knudsen Corporation. Soil Vapor
Extraction Treatability Study Report, Well Number 3 Subsite, U.S. EPA ARCS,
July 1991.